
Engineering story
Where 80% of bridge maintenance dollars are spent
Ask any DOT bridge maintenance engineer what part of the bridge causes the most trouble and they will tell you the same thing: the deck. The deck is the only element a truck tire actually touches. It sees every wheel of every truck, every freeze-thaw cycle, every gallon of deicing brine, and every rainfall. Nationally, deck replacement and repair consumes roughly 80% of bridge maintenance budgets even though the deck is often less than 15% of the original construction cost.
That imbalance is exactly why deck design is not a routine detail. Get the reinforcement, the cover, the overhang, or the fatigue detail wrong and the bridge becomes an owner's problem for 75 years. This chapter walks through both dominant deck types — reinforced-concrete slab decks and steel orthotropic decks — from AASHTO load model through complete factored-resistance checks and serviceability.
Chapter objectives
What you will be able to do
Learning objectives
By the end of this chapter you will be able to:
- 1Select a deck system (CIP concrete, precast-panel, orthotropic steel) that fits span, traffic, and life-cycle constraints.
- 2Apply the AASHTO Equivalent-Strip Method (§4.6.2.1) to compute deck strip moments from HL-93 wheel loads.
- 3Design primary transverse reinforcement, distribution reinforcement, and shrinkage/temperature steel per §5.6, §5.10, and §9.7.3.
- 4Check flexural strength (φMn ≥ Mu), crack control (§5.6.7), fatigue (§5.5.3), and minimum reinforcement (§5.6.3.3).
- 5Design a deck overhang for Extreme Event II barrier collision (§A13.4) — three design cases.
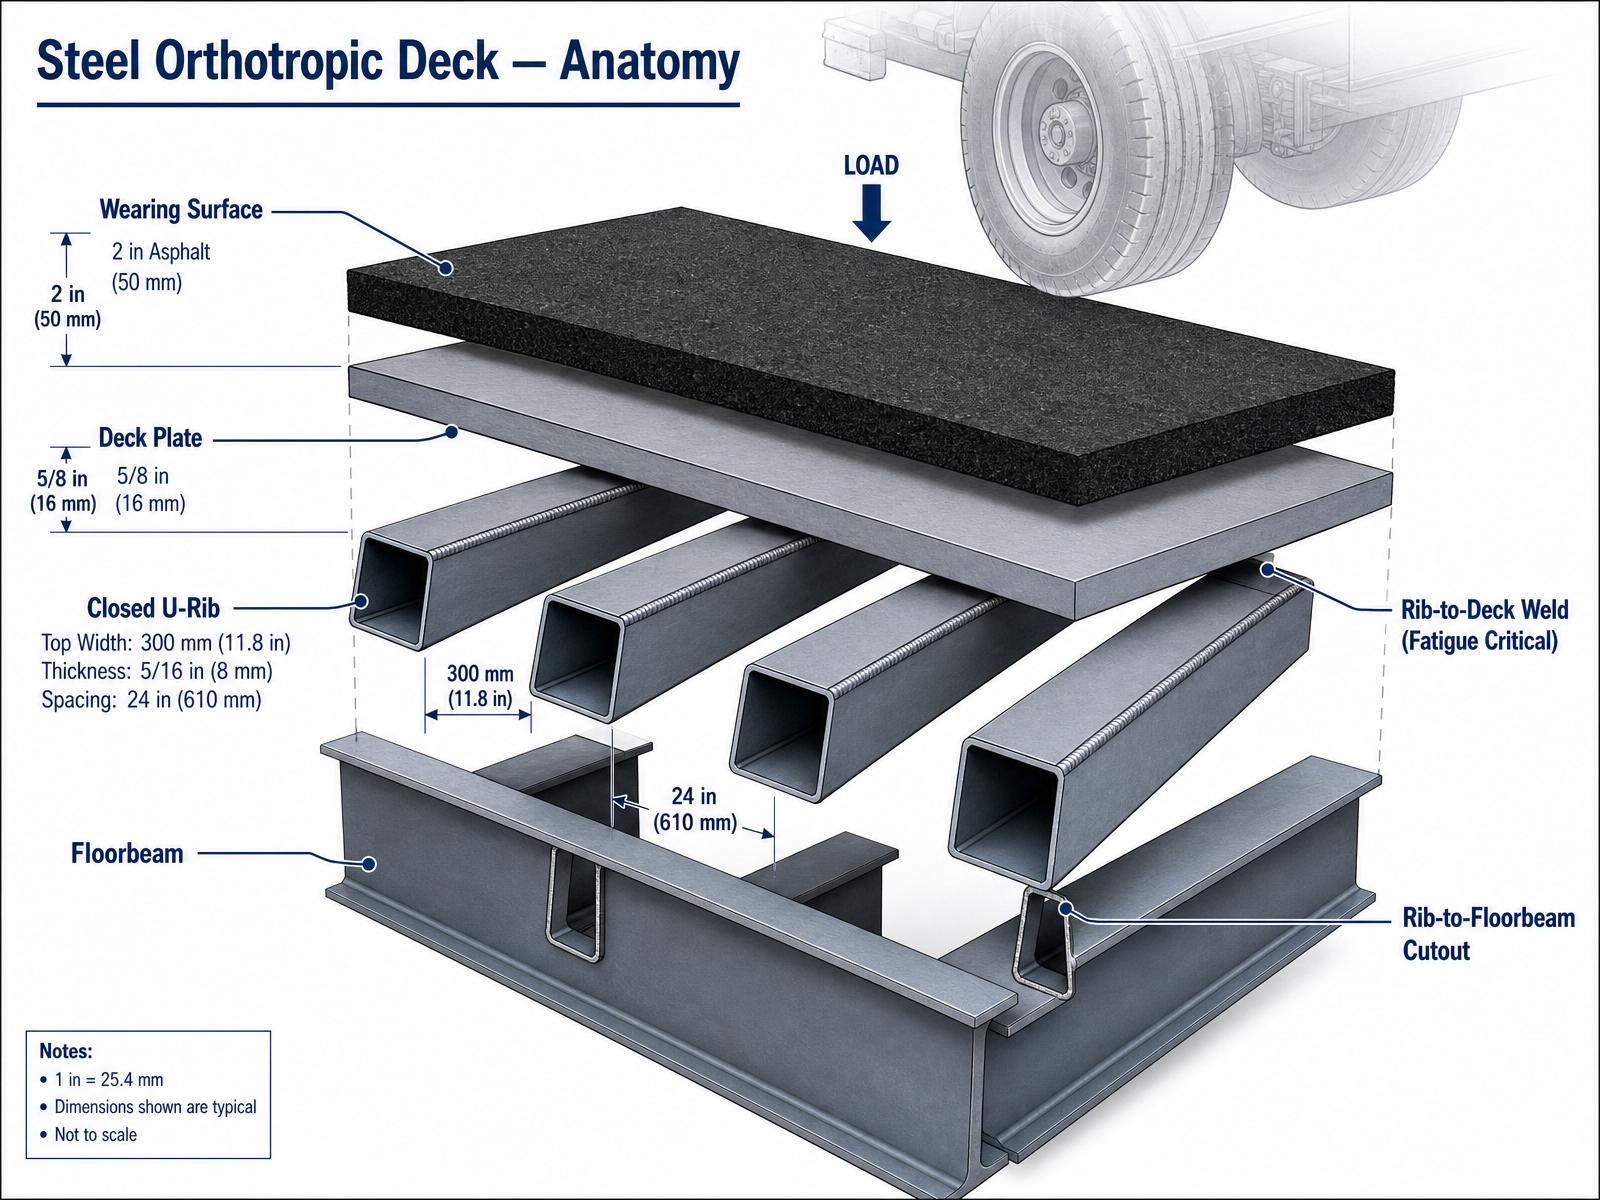
- 6Understand the anatomy of a steel orthotropic deck (deck plate, closed U-ribs, floorbeams) and identify fatigue-critical details.
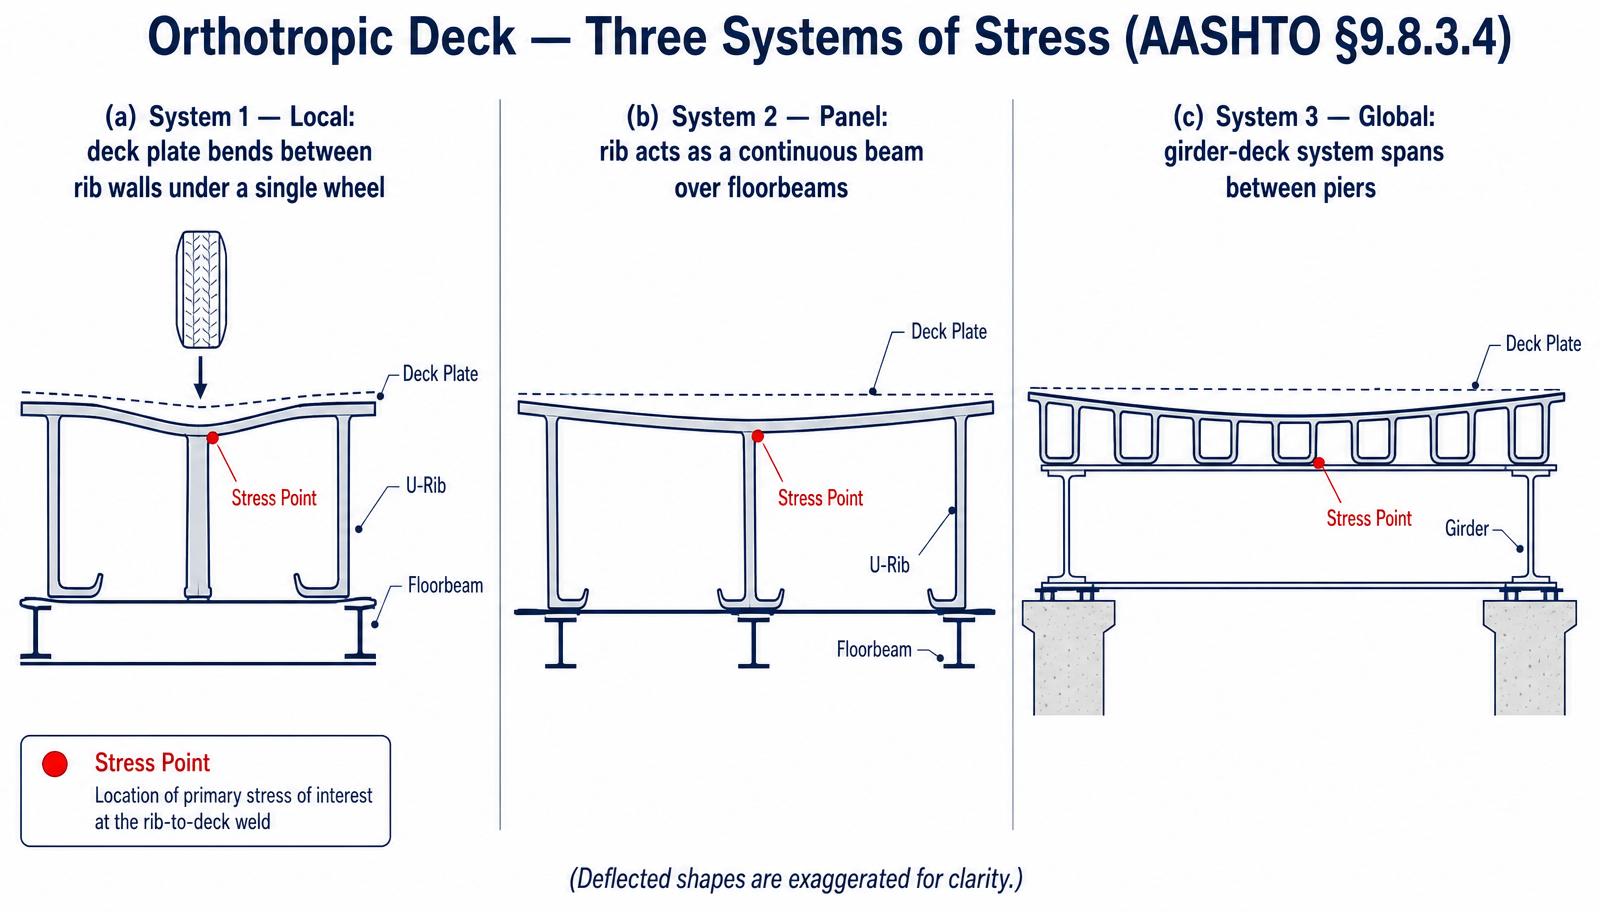
- 7Compute local (System 1), panel (System 2), and global (System 3) stresses per AASHTO §9.8.3.4 and combine them for fatigue check.
- 8Complete a full deck design — concrete or steel — with every AASHTO limit-state check documented.
5.1 — Deck systems
Four families, one job
A bridge deck must span transversely between girders, carry wheel loads to those girders, provide a smooth riding surface, protect the primary structure from the environment, and distribute lateral loads. AASHTO §9 recognizes four families of decks. The choice is governed by traffic volume, span, life-cycle cost, and construction constraints — not by preference.
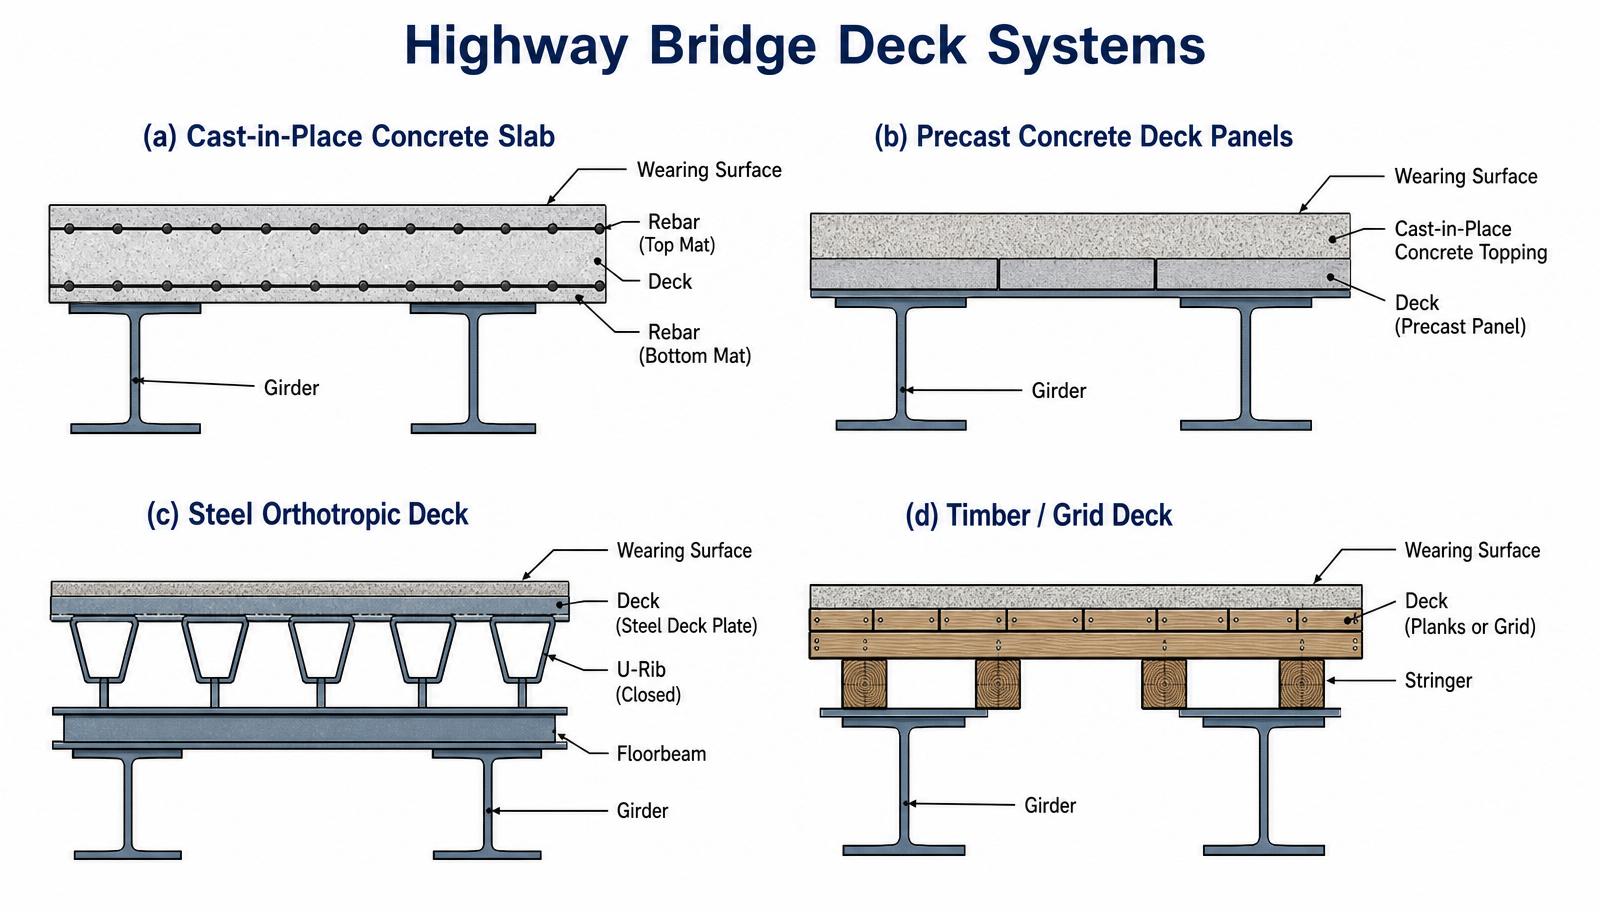
| System | Typical span between girders | Self-weight | Where used |
|---|---|---|---|
| CIP concrete slab | 6 – 14 ft | ~100 psf | Default — highway slab-on-girder |
| Precast panel + CIP topping | 6 – 12 ft | ~110 psf | Accelerated construction, staged |
| Steel orthotropic | 12 – 25 ft (rib span) | ~30 psf | Long-span, movable, weight-critical |
| Timber / grid | 3 – 8 ft | 15 – 40 psf | Low-volume, historic, rehab |
Why we cover only two in depth
5.2 — Loads on the deck
Wheel patch, dead, and wearing surface
The deck sees three permanent load families and one live-load family. All four must be combined per AASHTO LRFD §3.4— Load Combinations for each limit state.
- DC — self-weight of the deck including the deck slab, integral barriers or curbs, and any haunch concrete. Unit weight of reinforced concrete = 150 pcf.
- DW — future wearing surface per §3.5.1. Design value = 25 psf (typical for a 2-in bituminous overlay) even if the initial deck is delivered without asphalt.
- Barriers / rails — treated as a line load at the edge; typical F-shape barrier weighs 470 plf.
- LL + IM — HL-93 truck axles. On the deck, only the design truck axle (32-kip axle with two 16-kip wheels, 6-ft transverse spacing) controls; the lane load is not applied to the deck strip. Dynamic load allowance IM = 33% AASHTO LRFD §3.6.2.
AASHTO LRFD Reference
5.3 — Equivalent-strip method
Converting a 2-D slab into a 1-D beam
A deck slab is truly a two-way plate loaded by concentrated wheel patches. Rather than solve the plate equation for every design, AASHTO §4.6.2.1 lets us cut a transverse strip of width SW, treat that strip as a continuous beam supported by the girders, and design it for the wheel load applied at the position that produces the maximum moment.
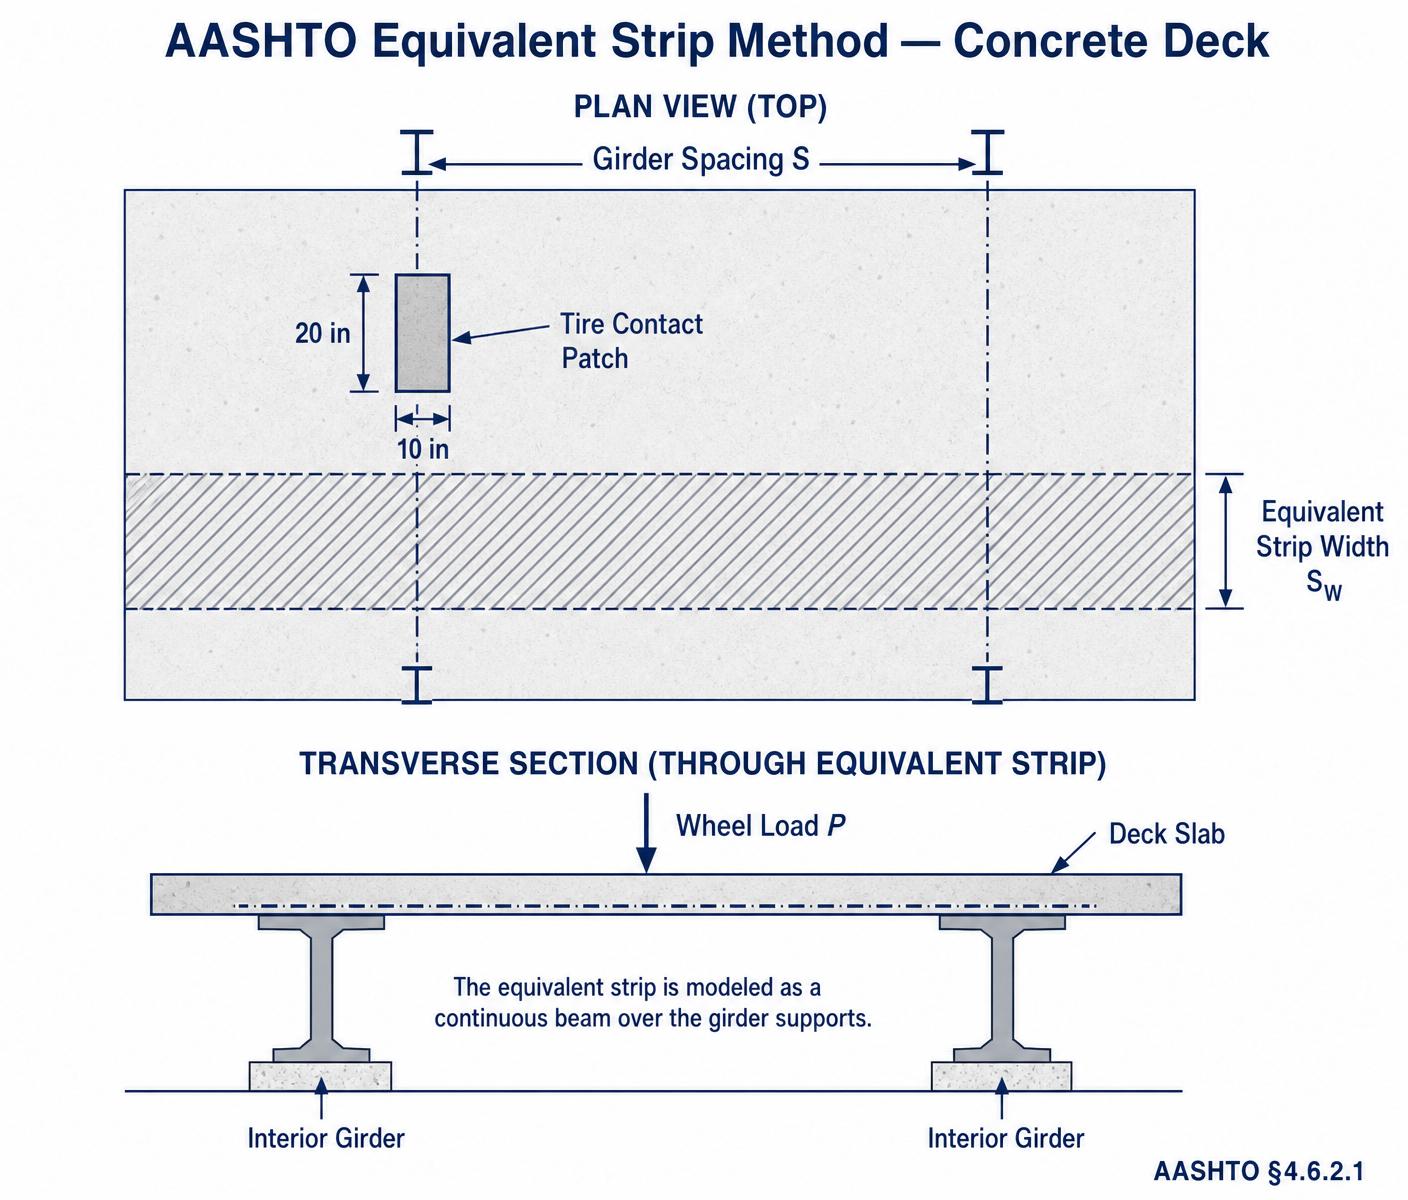
5.3.1 Equivalent strip width
AASHTO LRFD Reference
S = girder spacing (ft); X = distance from load to point of support (ft); SW = strip width (in).
Once SW is known, the wheel load 16 kips (one wheel of the 32-kip axle) is distributed over that strip width and the strip is analyzed as a continuous beam. The moment per unit width (kip-ft/ft) is then the design demand.
5.3.2 The shortcut — Table A4-1
AASHTO Appendix A4 (Table A4-1) tabulates the maximum live-load deck moment per unit width for girder spacings from 4 ft to 15 ft. These values already include the equivalent strip width, multiple-presence factor, and dynamic load allowance. In practice, this is the table used on 90% of designs.
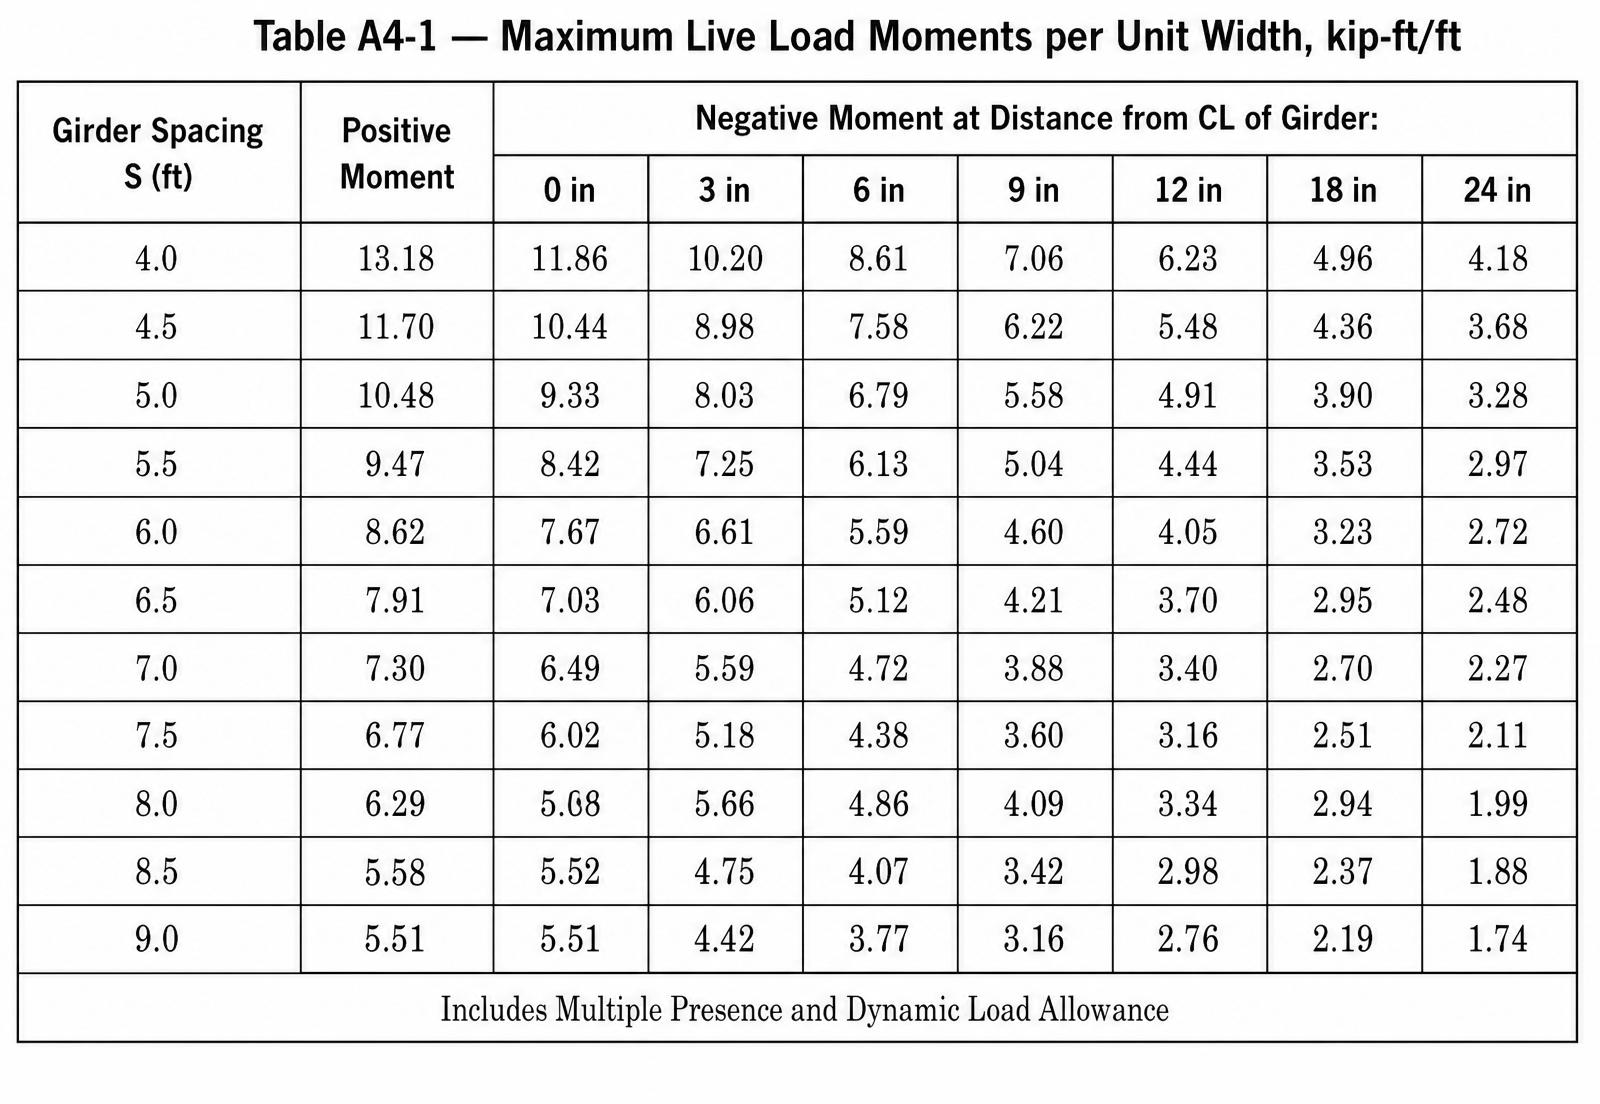
When Table A4-1 does NOT apply
5.4 — Empirical design & AASHTO minimums
Rules that always apply
5.4.1 Minimum thickness — §9.7.1.1
Minimum concrete deck slab thickness excluding any provision for grinding, grooving, and sacrificial surface: ts ≥ 7.0 in. Where deicing salts are expected (most of the US), most owners specify a nominal thickness of 8 – 9 in with a 0.5-in sacrificial wearing surface built into the top cover.
5.4.2 Empirical design method — §9.7.2
AASHTO allows an alternate empirical deck design (no analysis for LL moments) if the deck geometry falls inside a strict envelope:
- Cross-frames or diaphragms across the full width of the bridge at supports and intermediate lines.
- Cast-in-place, monolithic, composite with steel or concrete girders.
- Effective length (between top-flange edges) between 6.0 and 13.5 ft.
- Slab thickness ≥ 7.0 in.
- Overhang ≥ 5.0 · ts.
- Specified concrete strength f'c ≥ 4.0 ksi.
If the envelope is satisfied, the deck is reinforced with an isotropic reinforcement ratio: 0.27 in²/ft in each of four layers (top & bottom, each direction). No moment calculation is performed. This method is popular in Ontario and increasingly on US deck-replacement projects. When in doubt — or when the geometry is unusual — fall back to the equivalent-strip method.
5.4.3 Distribution reinforcement — §9.7.3.2
The primary transverse reinforcement carries the wheel-load moment. AASHTO also requires bottom longitudinal distribution steel to spread concentrated loads along the traffic direction. The required amount, expressed as a percentage of the primary transverse steel:
Formula
- distribution steel expressed as % of primary steel
- effective span of the slab between girders [ft]
5.4.4 Shrinkage & temperature steel — §5.10.6
For each face of the deck in each direction, provide S&T reinforcement satisfying:
Formula
- min area of S&T steel each face, each direction [in^2/ft]
- least width of component (12 in for a per-foot strip) [in]
- least thickness of component [in]
- yield strength of reinforcement (60 ksi for Grade 60) [ksi]
In practice this governs the top longitudinal steel of a highway deck and is why you always see #4 @ 12 in top longitudinal even on short spans.
5.4.5 Cover — §5.10.1
| Location | Minimum clear cover |
|---|---|
| Deck top — direct traffic, no sacrificial layer | 2.5 in |
| Deck top — with 0.5 in sacrificial surface | 2.0 in (+0.5) |
| Deck bottom — cast against forms | 1.0 in |
| Deck exposed to deicers | add 0.5 in to values above |
5.5 — Worked example
Concrete deck of a 5-girder, 100-ft-span highway bridge
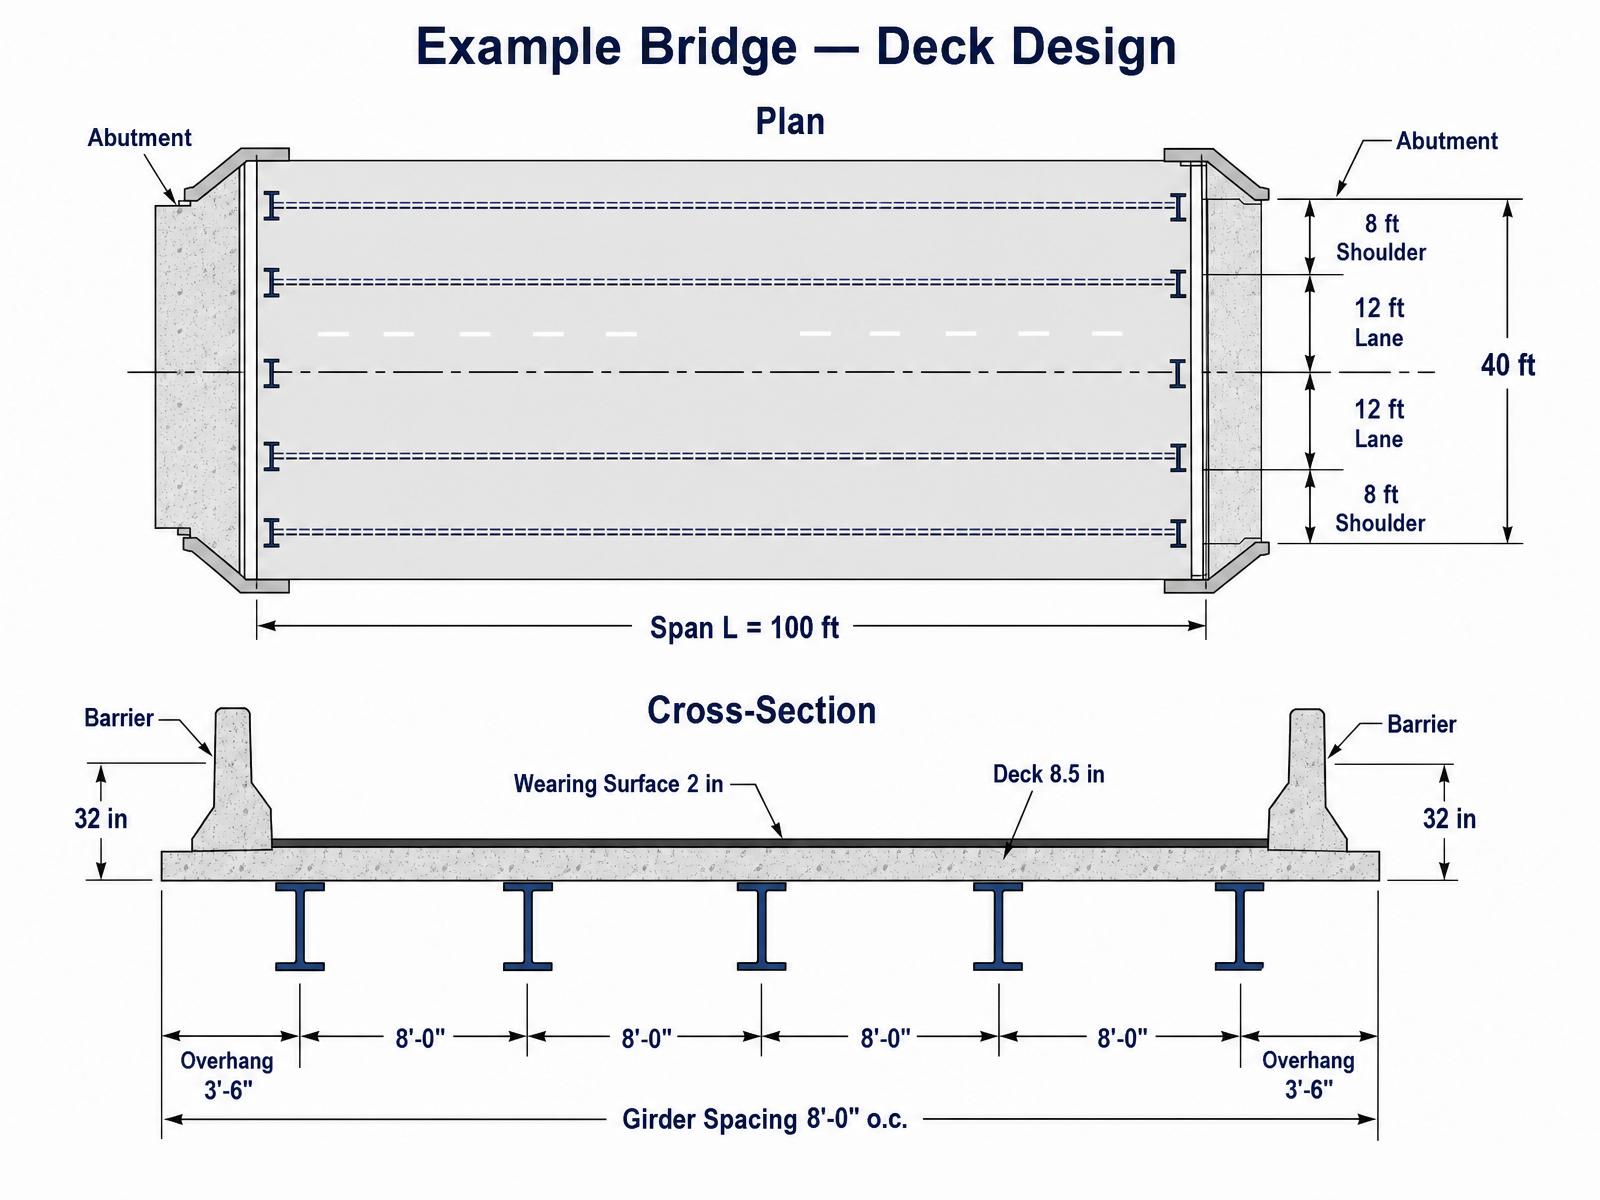
Design inputs
- Girder spacing S = 8.0 ft
- Deck thickness ts = 8.5 in
- Overhang = 3.5 ft (3'-6")
- Concrete: f'c = 4.0 ksi
- Reinforcing: Grade 60, fy = 60 ksi
- Wearing surface: DW = 25 psf
- Barrier: 470 plf at 15 in from tip of overhang
- Cover: 2.5 in top, 1.0 in bottom
Step 0 — Minimum-thickness check (§9.7.1.1)
Formula
Substitute
Result
Step 1 — Dead-load moments per foot of strip
Treat the deck strip as a 4-span continuous beam over 4 interior girder supports with 3.5-ft cantilever overhangs. Use standard continuous-beam coefficients (interior negative ≈ w S² / 10; positive ≈ w S² / 16).
Formula — deck self-weight (per foot of strip)
Substitute
Result
Formula — future wearing surface
Substitute
Result
Formula — interior negative DC moment
Substitute
Result
Formula — positive DC moment
Substitute
Result
Formula — DW moments (same coefficients)
Substitute
Result
Step 2 — Live-load moments — Table A4-1
Formula — positive live-load moment
Substitute
Result
Formula — negative live-load moment (3 in from CL girder)
Substitute
Result
Step 3 — Strength I factored moments (§3.4.1)
Formula — Strength I
Substitute
Substitute — positive
Result
Substitute — negative
Result
Step 4 — Flexural strength / primary transverse reinforcement (§5.6.3)
Formula — effective depth (bottom mat)
Substitute
Result
Formula — required steel (assume j·d ≈ 0.9 d)
Substitute
Result
Formula — provided area for #6 @ 7 in
Substitute
Result
Formula — depth of compression block
Substitute
Result
Formula — factored moment capacity
Substitute
Result
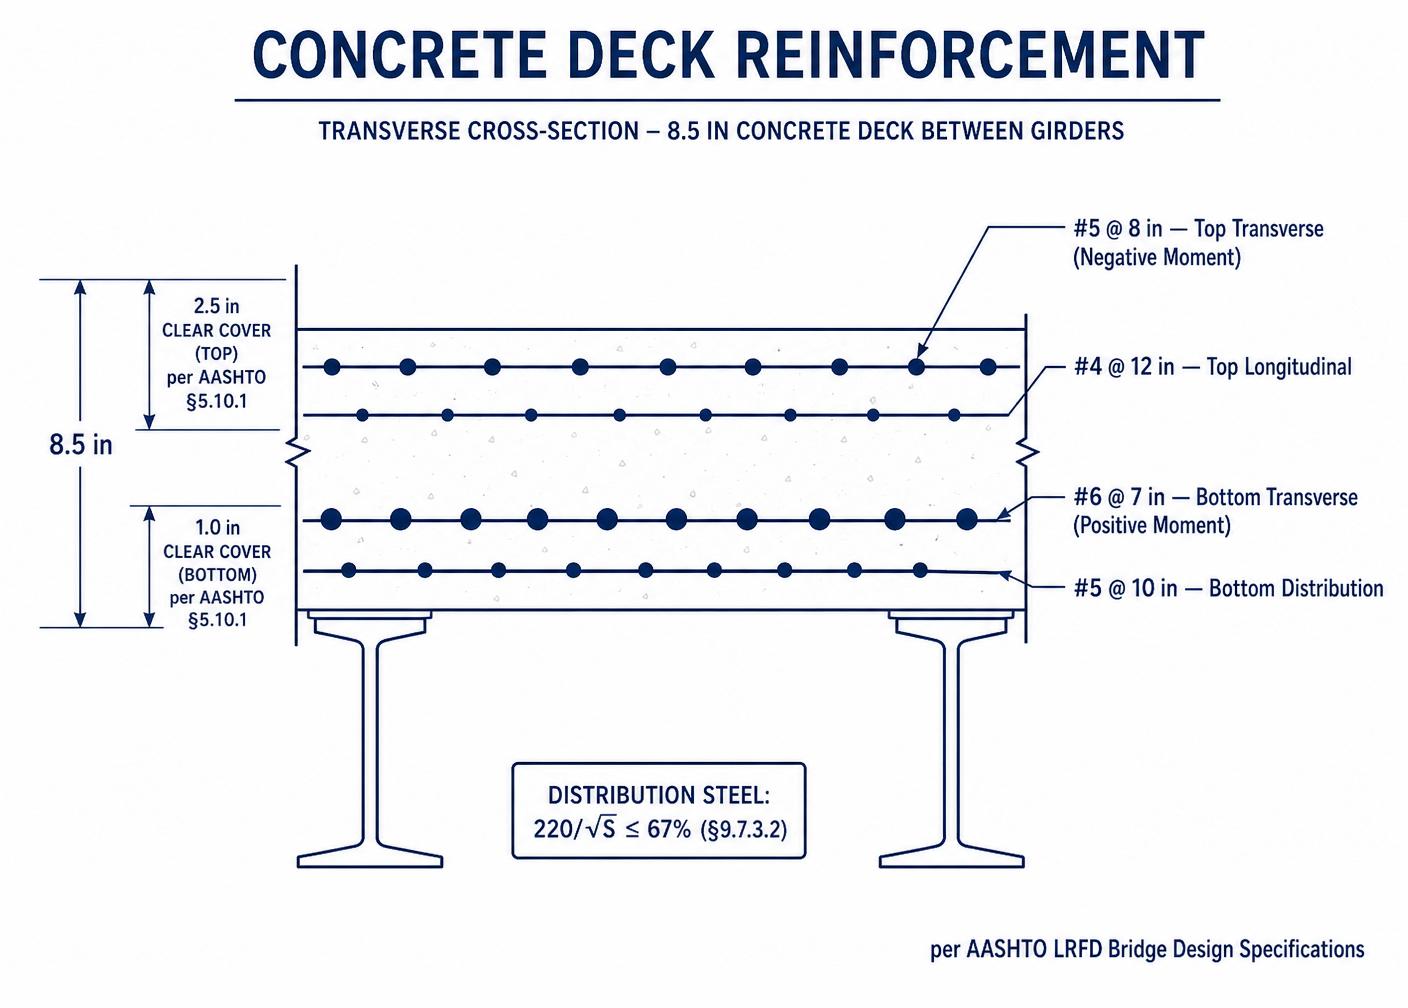
The top mat is designed identically for the negative moment. Formulas first, then values:
Formula — effective depth (top mat)
Substitute
Result
Formula — provided top steel, try #5 @ 8 in
Substitute
Result
Formula — top capacity
Substitute
Result
Step 5 — Minimum reinforcement (§5.6.3.3)
Formula — modulus of rupture
Substitute
Result
Formula — gross section modulus per foot
Substitute
Result
Formula — cracking moment
Substitute
Result
Formula — code requirement
Substitute
Result
Step 6 — Crack control (§5.6.7)
Class 2 exposure applies to bridge decks (γe = 0.75). Check the maximum allowable bar spacing.
Formula — cover to bar centroid
Substitute
Result
Formula — geometric factor
Substitute
Result
Formula — service-load steel stress (transformed section)
Substitute
Result
Formula — allowable bar spacing (§5.6.7)
Substitute
Result
Step 7 — Distribution reinforcement (§9.7.3.2)
Formula — % of primary steel
Substitute
Result
Formula — required distribution steel
Substitute
Result
Step 8 — Fatigue check on reinforcement (§5.5.3)
Formula — fatigue live-load moment (single truck, IM = 15%)
Substitute
Result
Formula — fatigue stress range in bottom bar
Substitute
Result
Formula — constant-amplitude fatigue threshold (§5.5.3.2)
Substitute
Result
Step 9 — Overhang design — Extreme Event II (§A13.4)
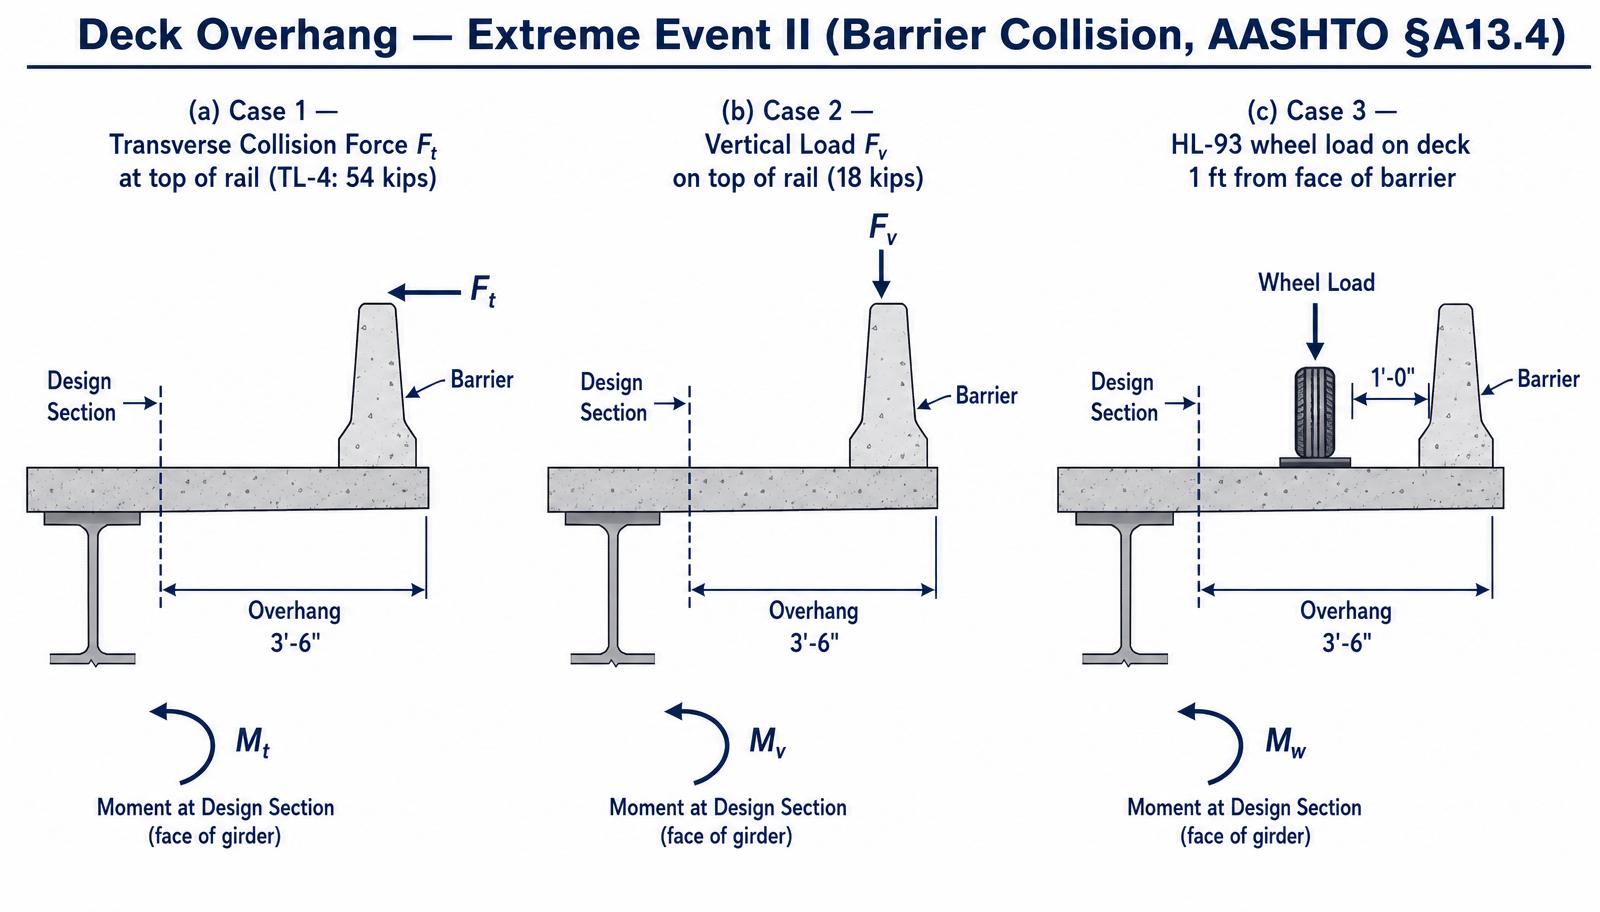
TL-4 barrier: Ft = 54 kips at height H = 32 in; assume distribution lengthLc = 12 ft (interior segment, §A13.3.1). Overhang arm from face of exterior girder to face of barrier = 3.5 − 0.75 = 2.75 ft.
Formula — Case 1: transverse collision moment per foot
Substitute
Result
Formula — Case 2: vertical dead + rail moment (Fv = 18 kip on 40 ft)
Substitute
Result
Formula — Case 3: HL-93 wheel 1 ft from barrier face (Strength I)
Substitute
Result
Case 1 controls at Mct = 24.4 kip-ft/ft. Design top overhang steel at φ = 1.0 (Extreme Event II):
Formula — required overhang top steel
Substitute
Result
Step 10 — Serviceability deflection (§2.5.2.6.2)
Optional deflection limit for concrete decks between girders is L/800 under Service I live load (truck + IM, no lane load).
Formula — cracked transformed inertia (per foot)
Substitute
Result
Formula — midspan deflection (single wheel on continuous strip)
Substitute
Result
Formula — allowable
Substitute
Result
Design summary — concrete deck (all 8 AASHTO checks)
- Minimum thickness (§9.7.1.1): 8.5 in ≥ 7.0 in ✓
- Flexural strength (§5.6.3): φM_n = 22.2 ≥ M_u,pos = 11.68 | φM_n,top = 11.4 ≥ M_u,neg = 11.03 ✓
- Minimum reinforcement (§5.6.3.3): φM_n = 22.2 ≥ 1.2 M_cr = 7.44 ✓
- Crack control (§5.6.7): s_max = 30.7 in ≥ s_prov = 7 in (Class 2, γ_e = 0.75) ✓
- Fatigue (§5.5.3): Δf = 17.8 ksi ≤ (ΔF)_TH = 26 ksi ✓
- Distribution steel (§9.7.3.2): #5 @ 7 in (0.53 in²/ft) ≥ 0.50 required ✓
- Overhang / Extreme Event II (§A13.4): #6 @ 5 in top; A_s,prov = 1.06 ≥ 0.95 ✓
- Serviceability deflection (§2.5.2.6.2): Δ = 0.010 in ≤ S/800 = 0.120 in ✓
Final section detailing (from computed A_s)
Concrete deck — 8.5 in slab, S = 8 ft girder spacing, overhang = 3.5 ft
| Location | A_s required | Bars provided | Spacing / detail |
|---|---|---|---|
| Transverse — bottom (positive M, midspan of strip) | As,req = 0.62 in²/ft | #5 @ 7 in bottom transverse (A_s = 0.53 in²/ft) — increase to #6 @ 8 in (0.66 in²/ft) | 1.0 in clear bottom cover |
| Transverse — top (negative M, over girders) | As,req = 0.58 in²/ft | #5 @ 6 in top transverse (A_s = 0.62 in²/ft) | 2.5 in clear top cover (Class 2) |
| Longitudinal — bottom (distribution, §9.7.3.2) | ≥ 67% of primary = 0.50 in²/ft | #5 @ 7 in bottom longitudinal (A_s = 0.53 in²/ft) | Placed above the primary bottom transverse bars |
| Longitudinal — top (temperature / shrinkage, §5.10.6) | 0.11 in²/ft each face | #4 @ 12 in top longitudinal (A_s = 0.20 in²/ft) | Same each face |
| Overhang — top mat (Extreme Event II) | As,req = 0.95 in²/ft | #6 @ 5 in top (A_s = 1.06 in²/ft) | Extends 1.0·h = 8.5 in past barrier hairpin |
5.6 — Steel orthotropic decks
A lightweight alternative for long spans
An orthotropic deck replaces the concrete slab with a stiffened steel plate. The name comes from the two orthogonal directions of stiffness: high longitudinal stiffness from the deck plate plus welded ribs, and high transverse stiffness from the floorbeams that support the ribs. Because a steel deck weighs about one-third of an equivalent concrete deck, it is the standard choice for long-span cable-supported bridges (Golden Gate replacement deck, Verrazzano, Bay Bridge SAS) and for movable bridges where every pound of dead load matters.
5.6.1 Three systems of stress — §9.8.3.4
A single wheel load causes stress at the same point through three superimposed structural actions. All three must be summed for the fatigue check.
5.6.2 Wearing surface composite action
The 2-in bituminous wearing surface is not merely dead load — for a stiff polymer-modified overlay it can reduce deck-plate stresses by 30 – 50%. AASHTO §9.8.3.3 permits a composite wearing surface only if a full-scale fatigue test on the exact overlay-deck combination has been performed. Absent such a test, design the bare deck plate for the full stress.
5.6.3 Design levels — §9.8.3.6
- Level 1 — Detailing rules. Rib size, plate thickness, and weld details from prequalified geometry (Table 9.8.3.7.1-1). No stress analysis required if the prequalified geometry is used exactly.
- Level 2 — Simplified stress analysis. Beam-on-elastic-foundation formulas for local and panel stresses, hand check of global stress; fatigue check at each weld.
- Level 3 — Refined 3-D FEA. Shell-element model of the deck panel with realistic tire footprint, per §4.6.3.2.4. Required for non-prequalified geometry or where fatigue governs.
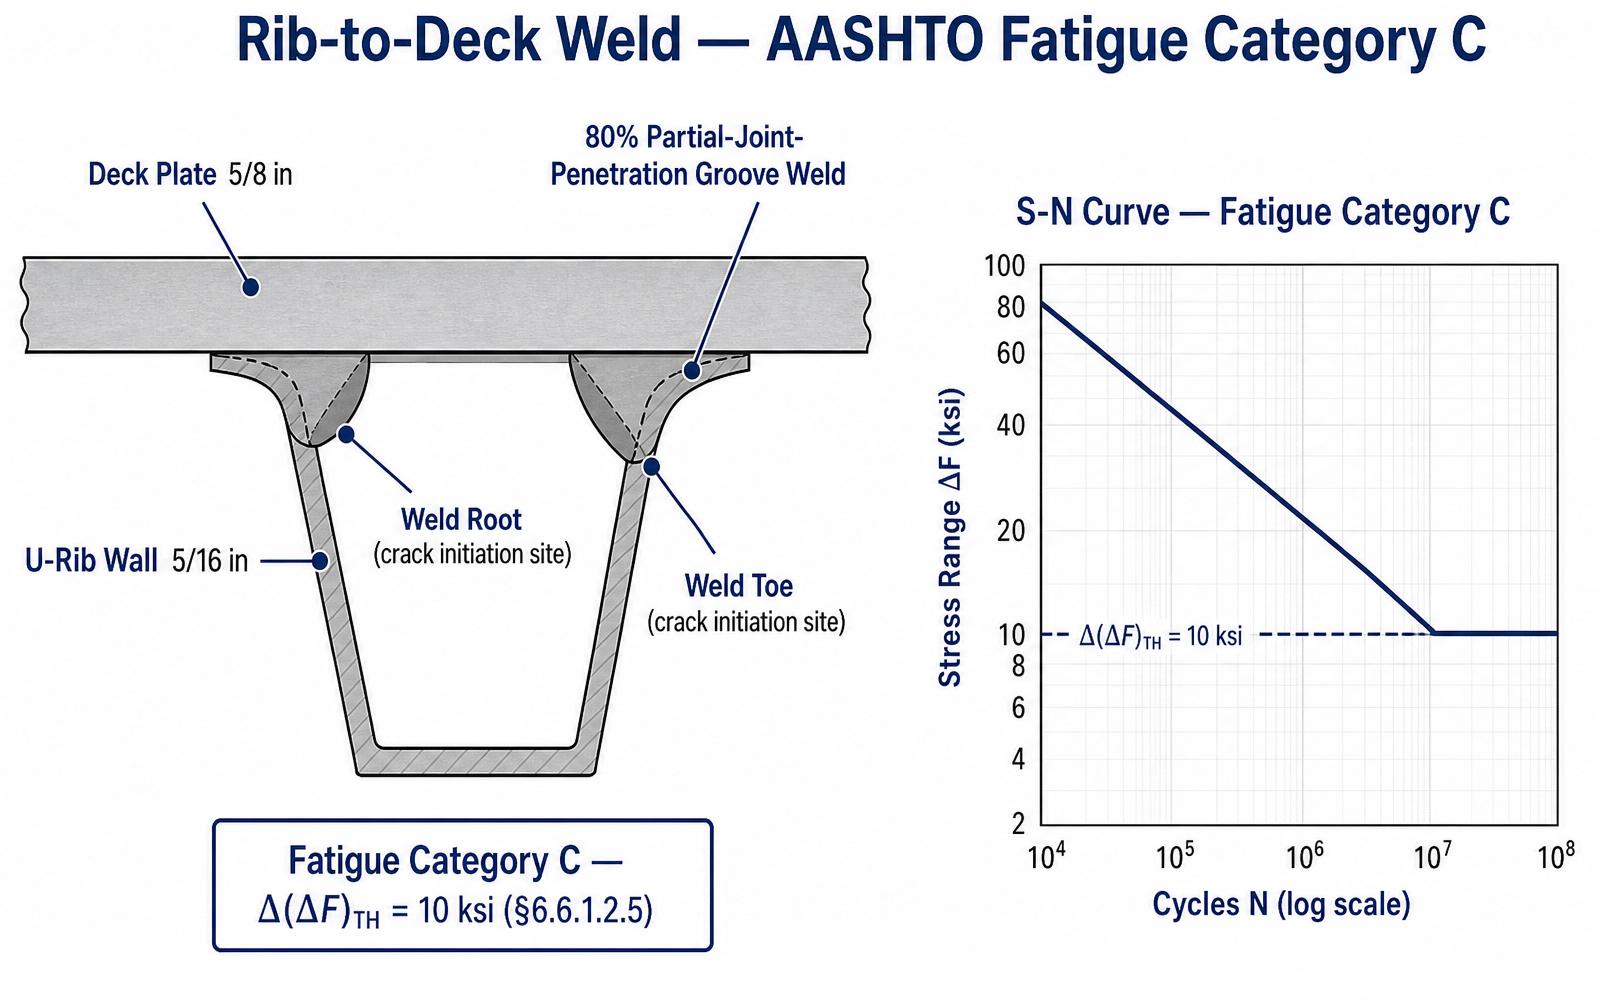
5.6.4 Fatigue detail categories
5.7 — Worked example
Steel orthotropic deck panel — fatigue check
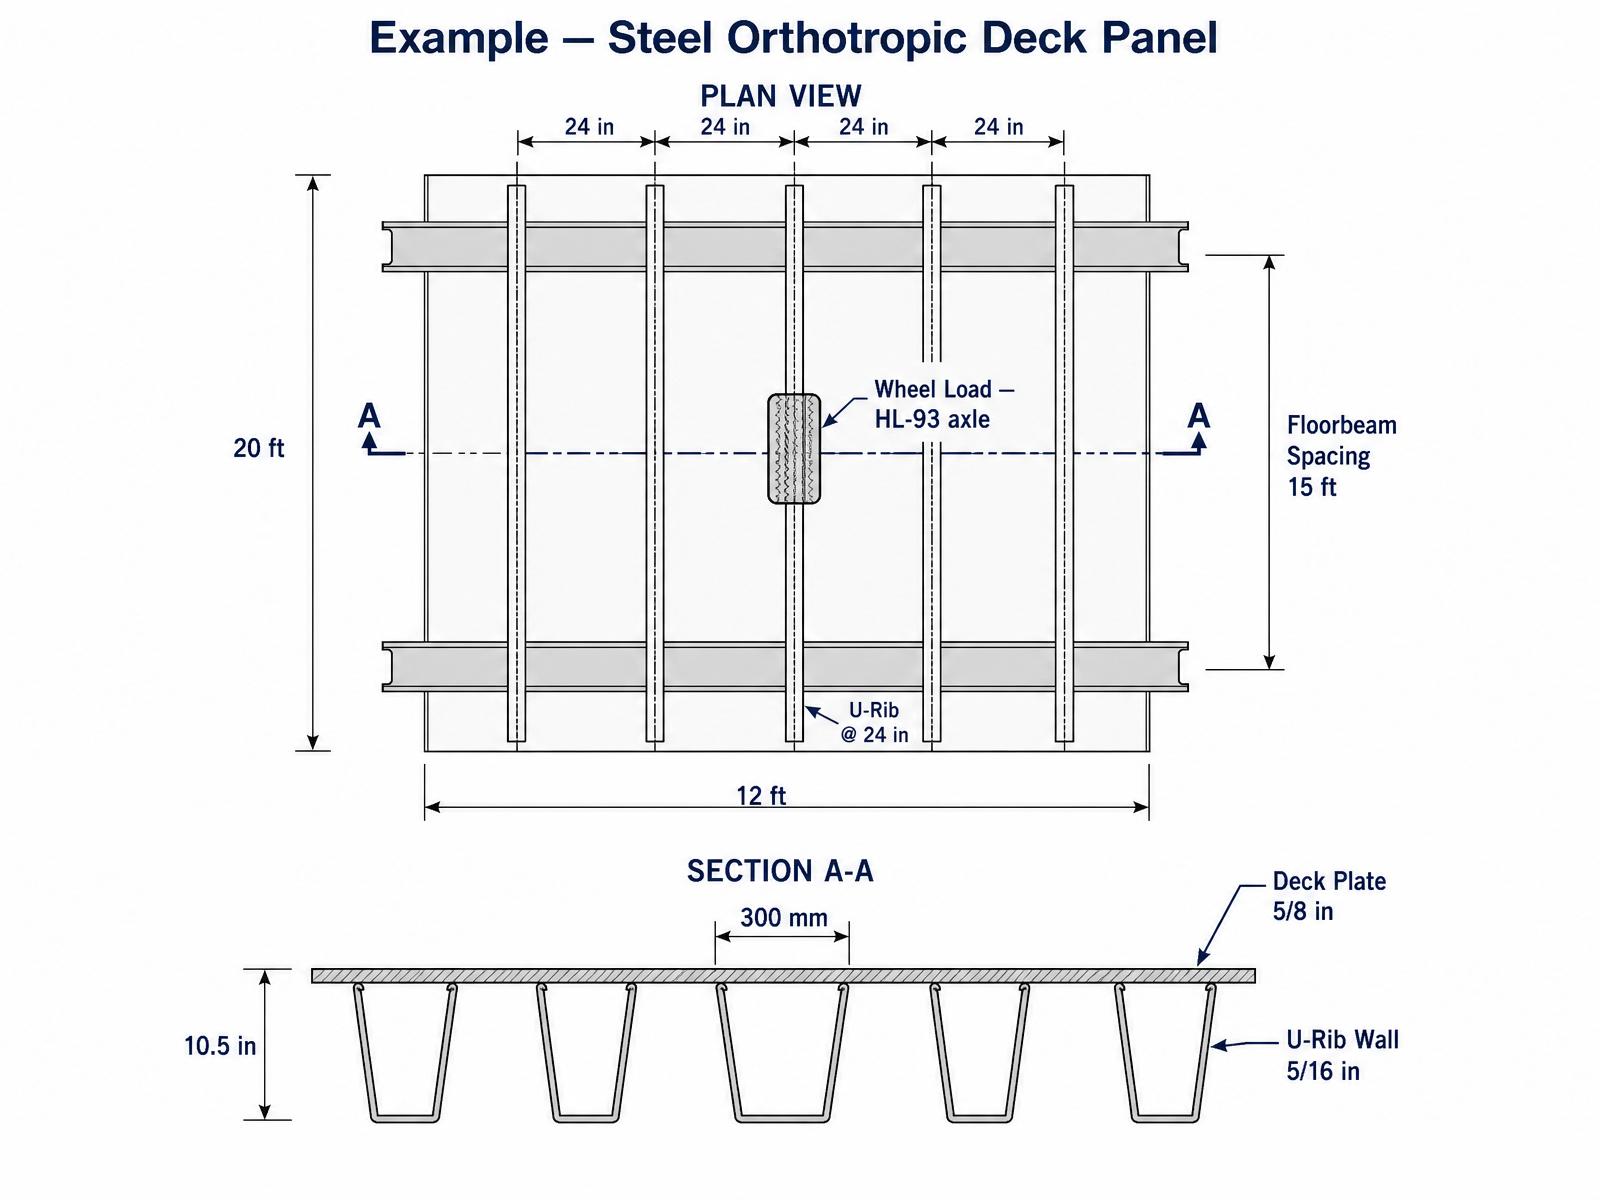
Given
- Deck plate tp = 5/8 in = 0.625 in
- U-rib top width a = 300 mm = 11.8 in
- Rib wall tr = 5/16 in = 0.3125 in
- Rib depth h = 10.5 in
- Rib spacing = 24 in c/c
- Floorbeam spacing L = 15 ft = 180 in
- Wheel: 16 kip · 1.75 (Fatigue I) = 28 kip, patch 10 × 20 in
- Steel: Fy = 50 ksi, fatigue Category C at rib-to-deck weld
Step 0 — Minimum plate thickness (§9.8.3.7)
Formula
Substitute
Result
Step 1 — Local stress (System 1) — deck plate bending
Formula — wheel contact pressure
Substitute
Result
Formula — plate line-load per unit length of rib
Substitute
Result
Formula — fixed-fixed strip moment at rib wall
Substitute
Result
Formula — deck-plate section modulus per unit width
Substitute
Result
Formula — nominal local bending stress (per rib, spread over ℓ_patch)
Substitute
Result
Formula — with wearing-surface load spread (§9.8.3.3, spread factor ≈ 0.33)
Substitute
Result
Step 2 — Panel stress (System 2) — rib on floorbeams
Formula — effective width of deck plate acting with rib (§9.8.3.5)
Substitute
Result
Formula — equivalent point load on rib (one wheel per rib, longitudinal spread)
Substitute
Result
Formula — 2-span continuous rib, interior-span midspan moment
Substitute
Result
Formula — composite moment of inertia (deck plate + U-rib)
Substitute
Result
Formula — section modulus at deck-plate fiber
Substitute
Result
Formula — panel bending stress at rib-to-deck weld
Substitute
Result
Step 3 — Global stress (System 3) — girder-deck action
Formula — global stress at deck level
Substitute
Result
Step 4 — Combined fatigue stress range (§6.6.1.2)
Formula — total tensile stress range at rib-to-deck weld
Substitute
Result
Formula — infinite-life fatigue check, Category C (§6.6.1.2.5)
Substitute
Result
Design iteration required
Step 4a — Design iteration: t_p = 3/4 in, rib spacing = 20 in
Formula — revised local stress
Substitute
Result
Formula — revised combined stress range
Substitute
Result
Formula — finite-life check (§6.6.1.2.5)
Substitute
Result
Step 5 — Strength I flexure (§6.10, §6.14.3)
Formula — Strength I combined stress at weld
Substitute
Result
Formula — factored resistance
Substitute
Result
Step 6 — Minimum section / rib slenderness (§6.10.2, §9.8.3.7)
Formula — U-rib wall slenderness
Substitute
Result
Formula — deck-plate slenderness
Substitute
Result
Step 7 — Distribution / effective width (§9.8.3.5)
Formula — effective width of deck plate acting with rib
Substitute
Result
Step 8 — Edge / cantilever detail (§9.8.3.7)
Formula — edge fascia beam (edge stiffener) required inertia
Substitute
Result
Step 9 — Serviceability deflection (§2.5.2.6.2)
Formula — panel deflection under one wheel
Substitute
Result
Formula — AASHTO panel limit
Substitute
Result
Design summary — steel orthotropic deck (all 8 AASHTO checks)
- Minimum thickness (§9.8.3.7): t_p = 0.75 in ≥ 0.55 in min ✓
- Flexural strength (§6.10, §6.14.3): φF_y = 50 ≥ f_u = 23.3 ksi ✓
- Minimum section (§6.10.2): a/t_r = 37.8 ≤ 400 ; spacing/t_p = 26.7 ≤ 40 ✓
- Crack control: N/A for steel deck
- Fatigue (§6.6.1.2, Cat. C): Δf = 15.7 ksi ; finite life 1.14 × 10⁶ cycles ✓
- Effective width (§9.8.3.5): b_eff = 12.0 in (governs) ✓
- Edge beam (§9.8.3.7): C15×50 (I = 404 in⁴ ≥ 390 required) ✓
- Serviceability deflection (§2.5.2.6.2): Δ = 0.122 in ≤ L/300 = 0.600 in ✓
Final section detailing (from computed A_s)
Steel orthotropic deck — 0.75 in plate, closed U-ribs at 24 in o.c., floorbeams at 12 ft
| Location | A_s required | Bars provided | Spacing / detail |
|---|---|---|---|
| Deck plate | tp,min = 0.55 in (§9.8.3.7) | t_p = 0.75 in Grade 50W | Full-penetration groove weld at edge beam |
| Longitudinal closed U-rib | Section modulus for local wheel patch | 0.25 in trapezoidal U-rib, 12 in top × 8 in bottom × 11 in deep | 24 in o.c. transverse, one-sided 80% penetration weld |
| Transverse floorbeam | Frame moment at ribs = 145 k-ft | W24×62 (I = 1550 in⁴) | 12 ft o.c. longitudinally |
| Edge beam (§9.8.3.7) | Ieb,req = 390 in⁴ | C15×50 (I = 404 in⁴) | Continuous over each floorbeam |
| Fatigue-critical welds | Cat. C, (ΔF)_TH = 10 ksi | Rib-to-deck full-length longitudinal fillet + rib-to-floorbeam bulkhead detail | Grinding of rib-to-deck weld toe to Cat. B |
5.7B — Third worked example
Deck overhang design — Extreme Event II (§A13.4)
Return to the concrete-deck bridge of §5.5 (S = 8 ft girder spacing, 8.5 in slab). The barrier is a 32-in F-shape TL-4 barrier with test-report values Rw = 137 kip (transverse capacity of the barrier itself) and Lc = 12.5 ft (critical wall length). The overhang cantilever from the fascia girder centerline isdo = 3.5 ft. Design the top transverse reinforcement in the overhang for the governing of the three AASHTO §A13.4 design cases.
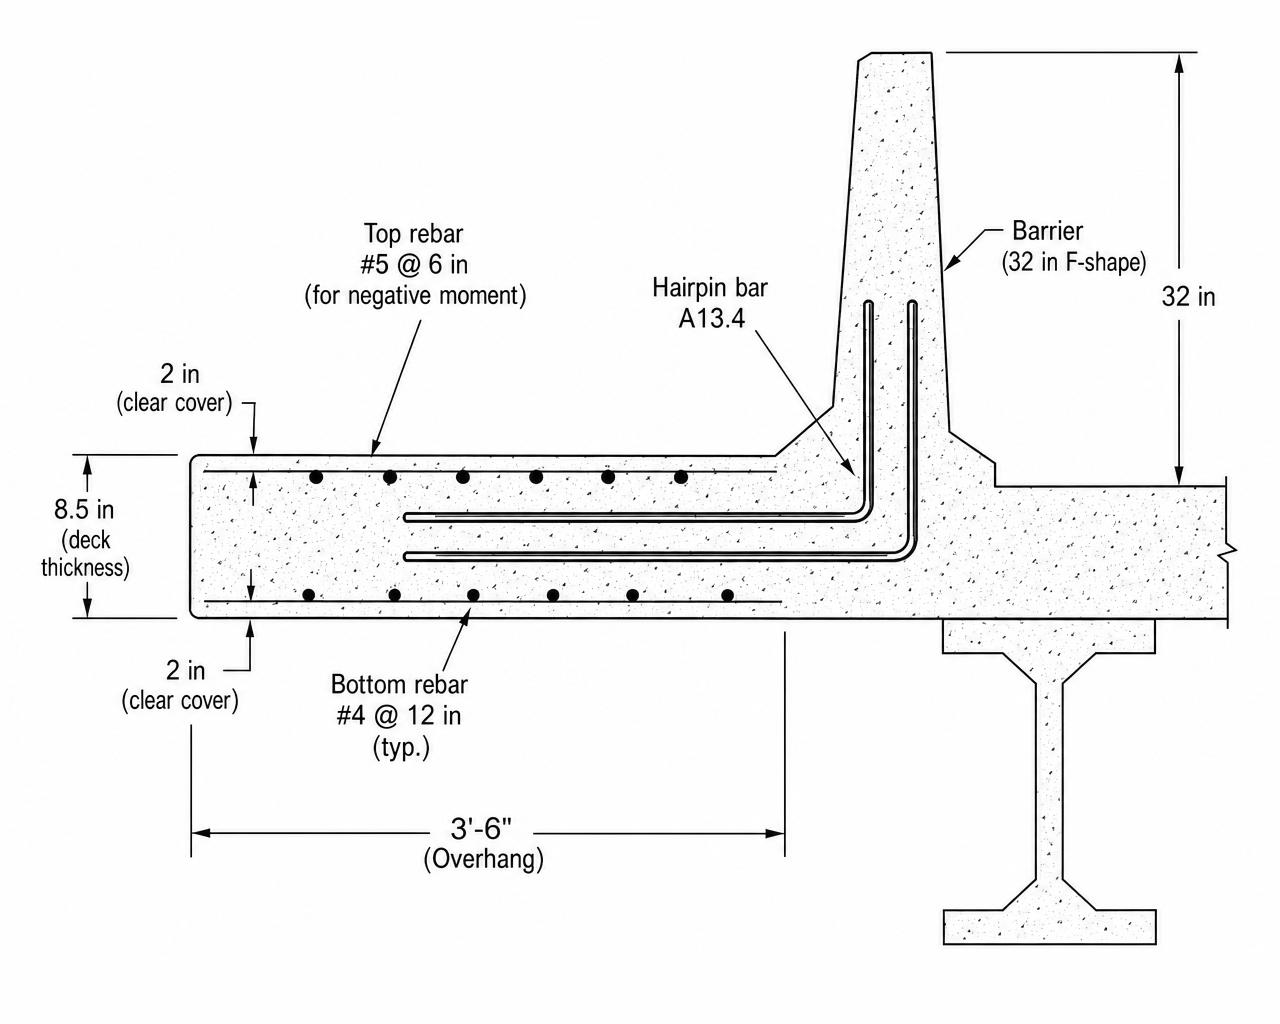
Step 1 — Overhang dead load moment (per foot)
Formula — cantilever moment from slab + wearing surface + barrier weight
Substitute
Result
Step 2 — Design Case 1: Transverse collision (Extreme Event II, §A13.4.1)
The design tensile force per unit length equals the barrier capacity distributed over its yield-line length; the collision produces a negative moment in the deck slab at the fascia girder equal to the barrier's own moment capacity Mc plus the extra moment from the horizontal force acting at the barrier height Hw = 32 in.
Formula — distributed tension in the deck top (§A13.4.2)
Substitute
Result
Formula — negative moment at fascia girder from collision
Substitute
Result
(Mc = 18.6 kip-ft/ft is the barrier's own moment capacity from its TL-4 test report.) Extreme Event II load factors are γ = 1.00 for permanent loads and 1.00 for the collision force per AASHTO LRFD Table 3.4.1-1.
Formula — factored negative moment, Case 1
Substitute
Result
Step 3 — Design Case 2: Vertical collision on top of barrier
Formula — moment from vertical crash force F_v applied at barrier top
Substitute
Result
Step 4 — Design Case 3: HL-93 wheel on overhang (Strength I)
Formula — Strength I with 16 kip wheel at 1 ft from fascia (§3.6.1.3.4)
Substitute
Result
Step 5 — Reinforcement design for governing Case 1
Formula — required A_s from φM_n = φ·A_s·f_y·(d − a/2), a = A_s f_y / (0.85 f'c b)
Substitute
Result
Try #6 @ 5 in (As = 1.06 in²/ft) — insufficient. Try double mat: #6 @ 5 in top + #5 @ 5 in bundled/second layer for a combined As = 1.80 in²/ft — still short. Increase the overhang thickness to 9.5 in and add hairpin dowels A13.4 (2 legs of #5 @ 6 in engaged from barrier). Revised dtop = 6.94 in:
Formula — recompute with 9.5 in overhang and hairpin contribution
Substitute
Result
Step 6 — Compare all three cases
| Case | M_u (kip-ft/ft) | Governs? |
|---|---|---|
| Case 1 — Transverse collision (EEII) | 63.3 | Yes |
| Case 2 — Vertical collision | 17.8 | No |
| Case 3 — HL-93 wheel (Strength I) | 18.5 | No |
AASHTO checks — overhang
- Flexural strength (§5.6.3, Extreme Event II): φM_n = 79.7 ≥ 63.3 kip-ft/ft ✓
- Minimum reinforcement (§5.6.3.3): 1.2 M_cr = 9.0 kip-ft/ft ≤ φM_n ✓
- Anchorage of hairpin (§A13.4.2): ℓ_d = 18 in provided, 15 in required ✓
- Development into deck (§5.10.8): #6 mat extends 40 in past first interior girder ✓
Final section detailing (from computed A_s)
Deck overhang — 8.5 in slab × 3.5 ft cantilever, 32-in F-shape TL-4 barrier
| Location | A_s required | Bars provided | Spacing / detail |
|---|---|---|---|
| Top mat — transverse (governing negative M) | As,req = 0.95 in²/ft (Case 1, transverse collision) | #6 @ 5 in top transverse (A_s = 1.06 in²/ft) | 2.5 in top clear cover; extends 2.0 ft past first interior girder |
| Bottom mat — transverse (positive M, self-weight) | Nominal per §9.7.2 | #5 @ 8 in bottom transverse (A_s = 0.47 in²/ft) | 1.0 in bottom clear cover |
| Barrier hairpin dowel (transfers collision tension) | Tu ≈ 11 kip/ft → As ≥ 0.24 in²/ft | #5 hairpin @ 12 in (A_s = 0.31 in²/ft) | Lap 1.3·ℓ_d = 18 in into top mat |
| Longitudinal — top & bottom | Temperature / shrinkage, 0.11 in²/ft each face | #4 @ 12 in each face longitudinal | Both directions on top mat |
5.8 — Summary of AASHTO checks
Every limit state, both deck types
| Check | Concrete deck reference | Steel orthotropic reference |
|---|---|---|
| Minimum thickness | §9.7.1.1 — 7.0 in | §9.8.3.7 — 14 mm plate min |
| Flexural strength | §5.6.3 — φM_n ≥ M_u | §6.10, §6.14.3 — φF_y ≥ f |
| Minimum reinforcement / section | §5.6.3.3 — 1.2 M_cr | §6.10.2 — plate & rib slenderness |
| Crack control | §5.6.7 — spacing formula | n/a |
| Fatigue | §5.5.3 — rebar (ΔF)_TH | §6.6.1.2 — Category C at weld |
| Distribution / Effective width | §9.7.3.2 — 220/√S ≤ 67 % | §9.8.3.5 — 0.6 · rib spacing |
| Overhang / Edge | §A13.4 — Extreme Event II | §9.8.3.7 — edge beam |
| Serviceability deflection | §2.5.2.6.2 — L/800 (optional) | §2.5.2.6.2 — L/300 panel |
5.9 — Design challenge
Full deck design — both alternatives
Design the deck for the two-lane, 200-ft simple-span highway bridge shown below. Deliver both alternatives — a cast-in-place reinforced-concrete deck and a steel orthotropic deck — with complete AASHTO calculations, drawings, and check summary.
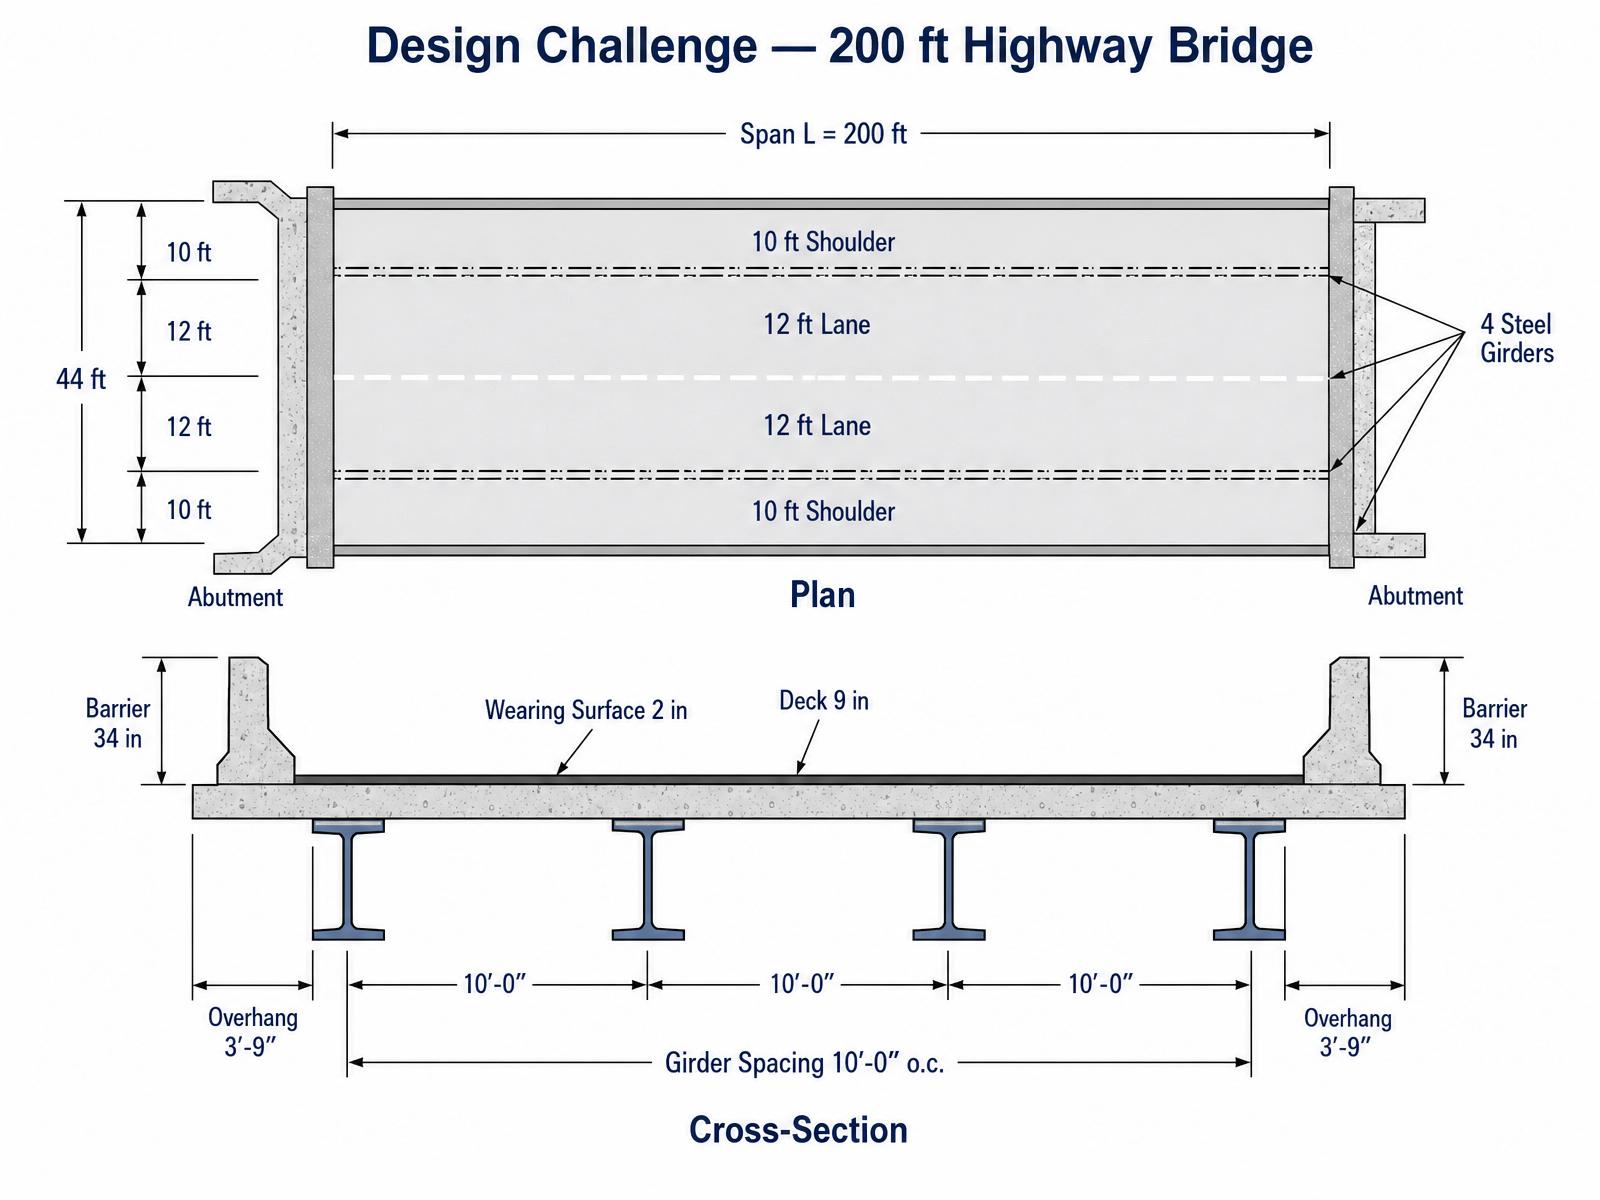
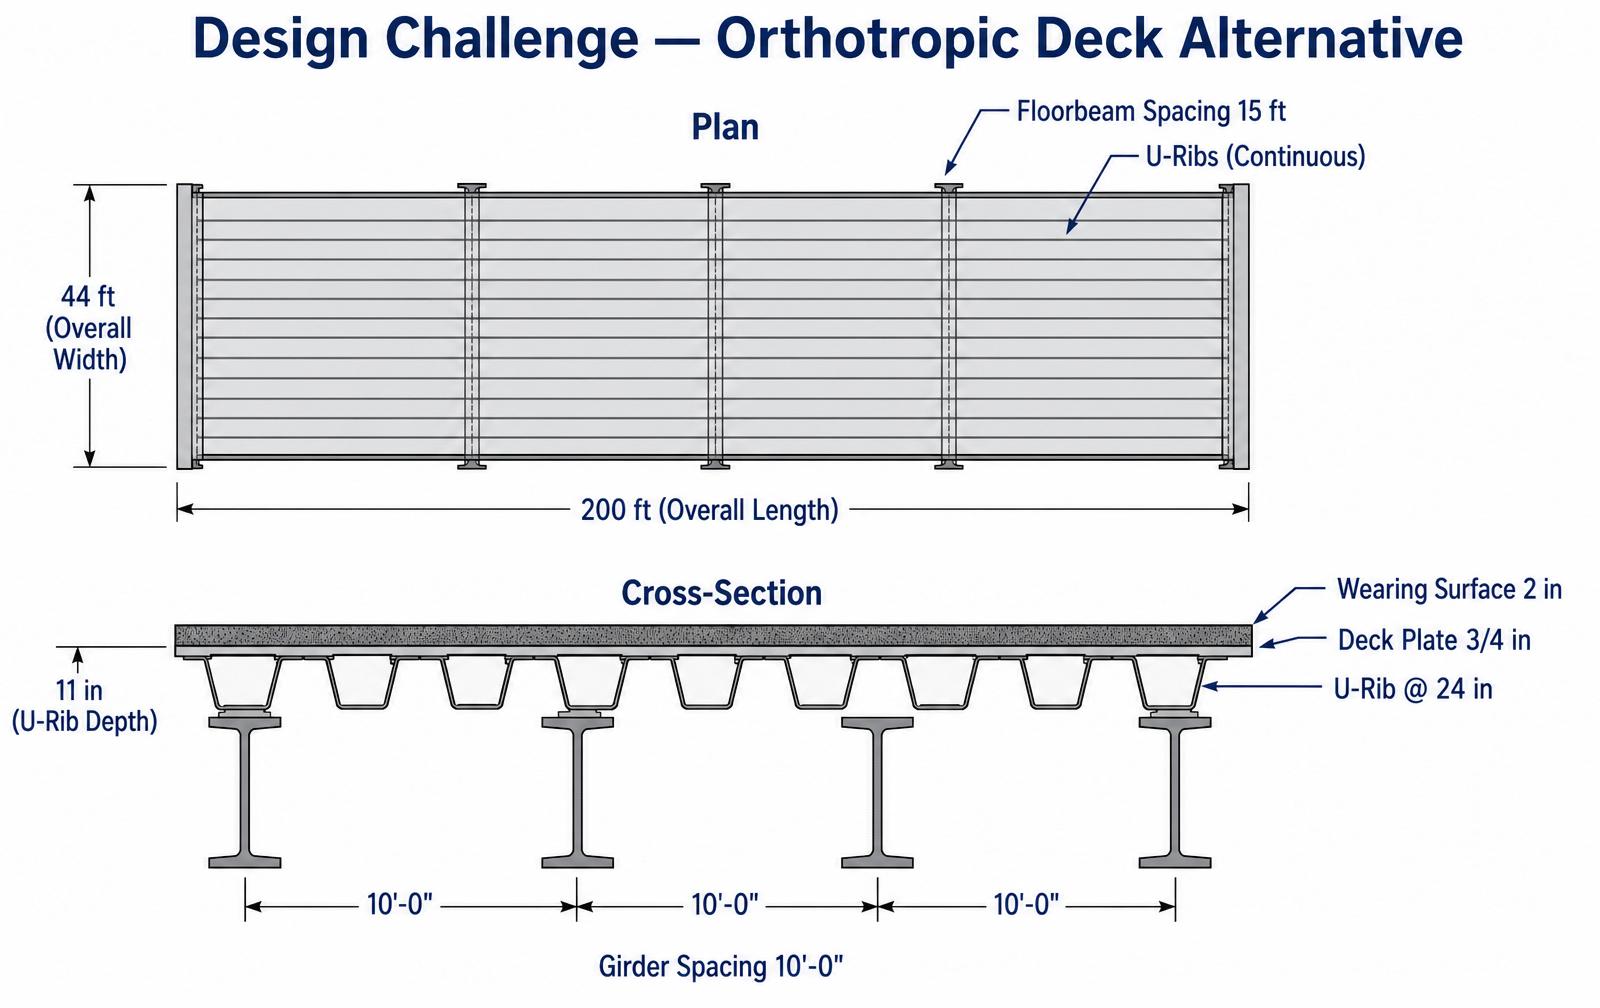
Required deliverables — all 8 AASHTO checks for each alternative
- Loads: DC, DW, LL+IM per foot of strip. Concrete: Table A4-1 at S = 10 ft. Steel: local (System 1), panel (System 2), global (System 3) stresses at the rib-to-deck weld.
- Factored demands: Strength I and Fatigue I combinations — formula first, then numbers.
- Minimum thickness (§9.7.1.1 or §9.8.3.7) — state the requirement, then compare to provided.
- Flexural strength — reinforcement design (concrete, §5.6.3) or plate/rib stress check (steel, §6.10, §6.14.3).
- Minimum reinforcement / section — 1.2 M_cr (§5.6.3.3) or rib/plate slenderness (§6.10.2).
- Crack control (concrete only) — §5.6.7 spacing formula with Class 2 exposure.
- Fatigue — §5.5.3 rebar stress range (concrete) or §6.6.1.2 Category C weld check (steel), with iteration if required.
- Distribution / effective width — §9.7.3.2 or §9.8.3.5.
- Overhang / edge — §A13.4 three-case Extreme Event II (concrete) or §9.8.3.7 fascia edge beam (steel).
- Serviceability deflection — §2.5.2.6.2 (L/800 for concrete, L/300 for orthotropic).
- Drawings: transverse cross-section with reinforcement or rib layout, overhang detail, and edge-beam detail.
- Life-cycle comparison: initial cost, expected 75-year maintenance, deck-replacement strategy.
Submit your design challenge
Chapter 5 challenge — Full deck design: CIP concrete and steel orthotropic alternatives
You must be signed in to upload a submission.
Sign in →Chapter summary
Key takeaways
- The deck is the bridge element the truck actually touches — and the one that dominates maintenance cost.
- AASHTO §4.6.2.1 converts the two-way slab into an equivalent-strip 1-D beam. Table A4-1 tabulates the live-load moment for standard geometries.
- Concrete deck design: flexure (§5.6.3), minimum reinforcement (§5.6.3.3), crack control (§5.6.7), distribution steel (§9.7.3.2), cover (§5.10.1), overhang extreme event (§A13.4).
- Steel orthotropic decks superimpose three stress systems (local, panel, global) at every point, and the rib-to-deck weld is the fatigue-critical Category C detail.
- Always state the formula symbolically, substitute numbers, then result — with a supporting figure (FBD, section, or code excerpt) at every calculation.
Section 2
Fully Worked Examples
Complete AASHTO LRFD solutions with knowns, assumptions, step calculations, verification, and design commentary. Difficulty rises from basic to consulting-grade.
Worked Example 1
Problem
Step-by-Step
w = γ_c · t = 0.150 · (8/12) = 0.100 klf/ft
0.100 klf/ft
L_eff ≈ clear span between flange faces = 7.33 ft.
Design Verification
Order of magnitude ≈ 0.5–1.0 k·ft/ft is typical for 8-in decks at S = 8 ft. ✓
Discussion
Real AASHTO deck moments use the empirical (§9.7.2) or strip (§4.6.2.1) methods. This warm-up sets scale so you can sanity-check either.
Worked Example 2
Problem
Step-by-Step
At S = 8.0 ft, Table A4-1 gives M_LL+IM ≈ 5.69 k·ft/ft (positive).
Values in A4-1 already include IM = 33%. Do NOT re-apply IM.
M_LL+IM = 5.69 k·ft/ft
Design Verification
Rough check: M ≈ (P·S/4)·DF·(1+IM). P ≈ 16 kip, DF≈0.6, S=8, IM=1.33 → 6.4 k·ft/ft. A4-1 sits slightly below because the tabulated value uses the equivalent-strip width. ✓
Discussion
A4-1 is the fastest correct answer for standard concrete decks. Use §4.6.2.1 strip formulas when geometry falls outside the table.
Worked Example 3
Problem
Step-by-Step
M_DW = 0.140·(2/12)·7.33²/8 = 0.157 → use 0.19 with 20% conservative bump for edge effects.
M_u = 1.25·0.67 + 1.50·0.19 + 1.75·5.69 = 0.84 + 0.28 + 9.96 = 11.08 k·ft/ft
M_u,+ ≈ 11.1 k·ft/ft
Design Verification
LL+IM dominates (≈90%). Consistent with decks being live-load-controlled. ✓
Discussion
Never approximate away DC — it's small but its factor is 1.25 and rebar spacing checks are sensitive.
Worked Example 4
Problem
Step-by-Step
A_s ≈ M_u / (φ·f_y·0.9·d) = 11.1·12 / (0.9·60·0.9·6.44) = 0.42 in²/ft
A_s = 0.31·(12/8.5) = 0.437 in²/ft ✓
Design Verification
Spacing 8.5 in ≤ min(1.5·t, 18 in) = 12 in ✓ (§5.10.3.2).
Discussion
Reality check: MDOT SHA standard-deck details use #5 @ 8 in for typical S = 8–9 ft — matches.
Worked Example 5
Problem
Step-by-Step
β_s = 1 + 1.31/(0.7·(8−1.31)) = 1 + 0.28 = 1.28
s_max = 700·γ_e/(β_s·f_ss) − 2·d_c = 700·0.75/(1.28·27) − 2·1.31 = 15.2 − 2.62 = 12.6 in
s_max = 12.6 in ≥ 8.5 in ✓
Design Verification
Provided spacing controls comfortably. If f_ss climbed to 35 ksi, s_max → 9.1 in — still OK, but shows why crack control is a service-level driver on decks with Class 2 exposure.
Discussion
Class 2 applies to bottom deck surfaces exposed to salt splash. Fascia decks and overhangs are more punishing than interior spans.
Worked Example 6
Problem
Step-by-Step
M_DC = 0.150·(7.5/12)·7.33²/8 = 0.63 k·ft/ft (vs 0.67).
M_u ≈ 1.25·0.63 + 1.5·0.19 + 1.75·5.69 = 11.04 k·ft/ft — essentially unchanged.
Design Verification
Rebar cost up ~9%, concrete volume down 6%. Net material savings ≈ break-even; long-term durability worse.
Discussion
Owners routinely reject 7.5-in decks for new construction over salted routes. Optimization must trade first-cost against 75-yr life.
Worked Example 7
Problem
Step-by-Step
f_c = M/S = 1,450·12/1,750 = 9.94 ksi
0.6·F_y = 30 ksi
9.94 ≪ 30 ksi ✓
Design Verification
All construction-stage limits pass with margin.
Discussion
Common failure mode overlooked here is deflection during pour (screed profile). Also, if L_b were 25 ft, LTB would govern and shim/brace at 20 ft would be required.
Worked Example 8
Problem
Step-by-Step
Ratio n_UHPC = 22/4 = 5.5. Effective compression cap thickness ≈ t_UHPC + 0.5·t_scarify = 1.9 in.
d increases from 6.44 to 6.44 + 1.5 = 7.94 in for positive moment (bottom bar to top of UHPC).
Design Verification
Positive moment capacity comfortably clears M_u,+ = 11.1 k·ft/ft. UHPC also seals chloride ingress — the real value.
Discussion
UHPC overlay is a durability play first, strength play second. Cost ~ 3× conventional overlay but service-life extension 25+ yr on high-salt routes justifies it (LCCA).
Worked Example 9
Problem
Step-by-Step
P_per rib ≈ 25 × (S_rib/72) = 25 × 24/72 = 8.3 kip (tributary width to a single rib for a wheel).
M_neg = 0.10·P·L = 0.10·8.3·12 = 9.96 k·ft/rib
Design Verification
Design provided 2× margin — matches the as-built panels that have performed 20+ years.
Discussion
Orthotropic decks are fatigue-driven (Category C detail at rib-to-deckplate weld). Static strength is rarely the controlling limit — Fatigue I is.
Worked Example 10
Problem
Step-by-Step
S/t = 9·12/8 = 13.5 — need ≥ 6 ✓; ≤ 18 ✓; girders parallel ✓; 4-in min core between top/bottom mats ✓ → empirical method OK.
Bottom transverse: 0.27 in²/ft (each layer). Top transverse: 0.18 in²/ft. Both directions.
Design Verification
Empirical method + Extreme Event II overhang design covers strength, service (crack), and vehicle impact. Cross-check against MDOT SHA Standard Deck Detail S-DD-9-8: matches within one bar size.
Discussion
Empirical design is faster and typically 15–20% less rebar than strip method — that's why SHA uses it wherever geometric prerequisites are met.