SE

This educational application supplements, but does not replace, the official AASHTO LRFD Bridge Design Specifications, applicable state DOT manuals, project specifications, and professional engineering judgment.

Case studies

Full-scale bridge design case files

Five in-service Mid-Atlantic crossings, each worked as a complete case file: vitals, the loads and analysis that govern, the detailing decisions, how the structure is deteriorating, and the one thing to take away. Built from MDOT SHA, FHWA and USACE public documents.
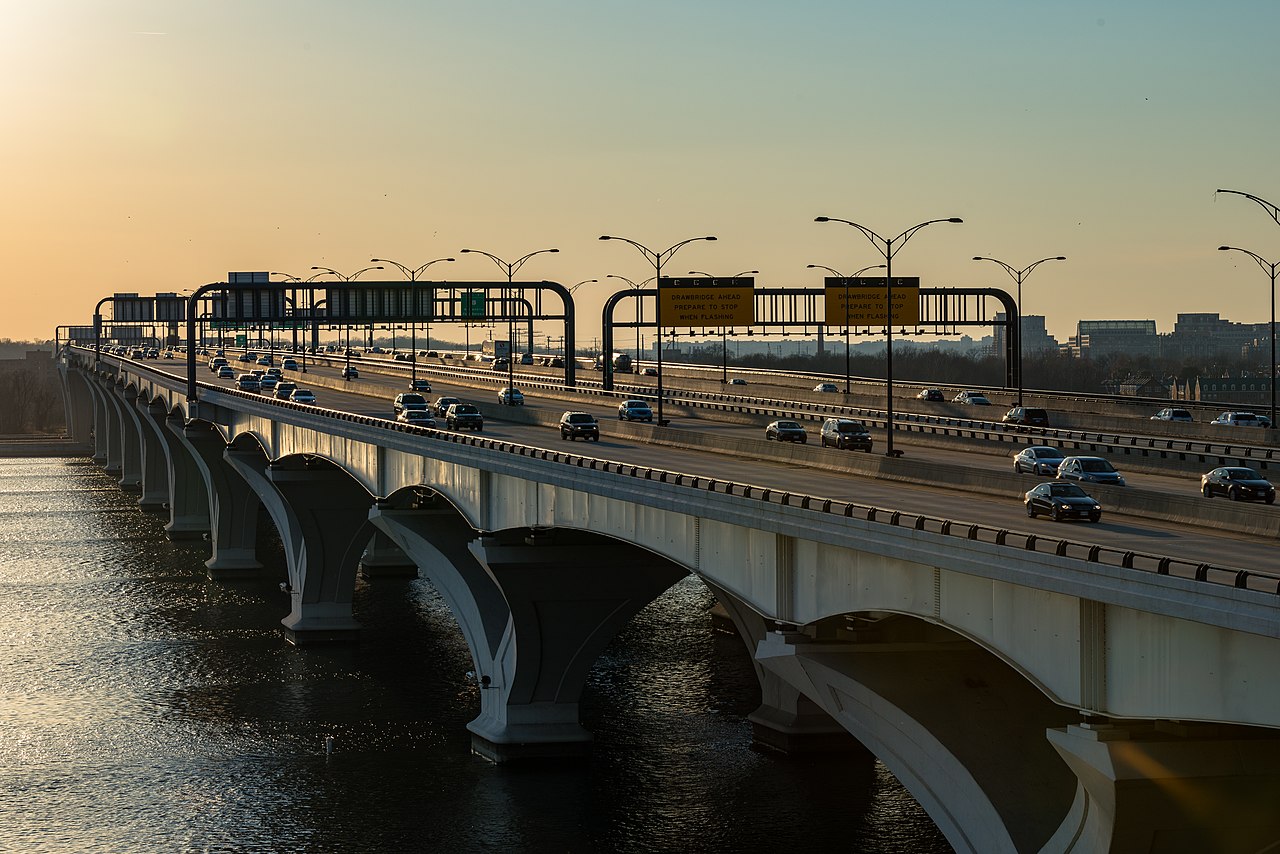
Woodrow Wilson Memorial Bridge (I-95 / I-495, MD–VA)

The twin bascule replacement over the Potomac. Two 6-lane parallel structures with a movable span in the navigation channel, opened 2006–2008.

Photo: Wikimedia Commons

Woodrow Wilson Memorial Bridge (I-95 / I-495, MD–VA)

Chapters 2, 4, 11, 15, 16

Crossing

Potomac River, Alexandria VA – Oxon Hill MD

Total length

≈ 6,075 ft, 70 spans

Movable span

double-leaf bascule, 175 ft clear

Superstructure

steel plate girders, composite deck

Vertical clearance

70 ft closed / unlimited open

Design ADT

≈ 250,000 vpd (2020s)

The 1961 original was a six-lane bascule carrying nearly four times its design volume, with a 50-year-old fracture-critical movable span. The replacement is the reference project for how a modern LRFD design handles staged construction over an active interstate and a federal navigation channel simultaneously.

Loads & analysis that govern

  • HL-93 with multiple presence per §3.6.1.1.2, plus Maryland and Virginia permit vehicles governing the strength check on several approach units.
  • Live-load distribution by the §4.6.2.2 formulas for the constant-depth approach girders, but by refined grillage analysis for the bascule leaves, where the moving-load path changes as the leaf rotates.
  • Bascule leaf balance is a design limit state of its own: counterweight mass, trunnion friction and wind on the raised leaf define the machinery demand, not the traffic loads.
  • Vessel collision per §3.14 on the channel piers, with an AF target of 0.0001 (critical bridge) — protection is by pier geometry plus fender energy absorption.
  • Extreme Event II combines scour, ice and vessel collision effects; the soft Potomac sediments make the scour case govern foundation depth.

Detailing decisions

  • Composite deck with epoxy-coated reinforcement and a 2-in integral wearing surface; deck design by the §4.6.2.1 equivalent-strip method.
  • Modular expansion joints at the bascule interface sized for the full thermal movement range of §3.12.2 plus bascule rotation.
  • High-load multi-rotational (pot and disc) bearings at the movable-span piers where rotation demand exceeds elastomeric capacity per §14.7.6.
  • Fracture-critical designation for the bascule leaf girders, with Zone 2 CVN toughness and hands-on inspection access built into the structure.

Deterioration & rehabilitation

  • Chloride exposure is severe: brackish tidal water plus winter deicing. Corrosion protection is a three-coat zinc-rich system with cathodic protection at the splash zone.
  • Machinery wear on the trunnions and racks is the controlling maintenance item — inspected annually, independent of the structural cycle.
  • The staged demolition of the 1961 structure while the new one carried live traffic is itself the construction-engineering case study: every stage needed its own stability model.

AASHTO references

  • AASHTO LRFD §3.6.1
  • AASHTO LRFD §3.14
  • AASHTO LRFD §4.6.2.2
  • AASHTO LRFD §14.7.6
  • AASHTO LRFD AASHTO LRFD Movable Highway Bridge Design Spec

Takeaway: A movable bridge is two structures — a bridge and a machine — and the machine's limit states are not in the girder calculations. Plan the inspection access and the staging model in the design phase, not after.

Interactive design workflow

You are checking the channel pier of the Woodrow Wilson movable span against §3.14 vessel collision, and confirming the counterweight balance condition for the bascule leaf that shares the pier.

Objective: Compute the design vessel impact force on the pier and the annual frequency of collapse, then verify the leaf's counterweight balance moment before signing off the machinery demand.

Stage 1 · Set the parameters

Transit speed of the design vessel at the pier location

From the waterway vessel traffic study

Total transits through the navigable span per year

Stage 2 · Computed steps

Convert vessel speed to design units

V(ft/s) = V(knots) × 1.688

Result: 13.5 ft/s

AASHTO's impact-force formula is calibrated with V in knots directly, but ship kinetic energy checks and closure-time screening need ft/s, so the conversion is carried alongside.

Design vessel impact force on pier, Ps

AASHTO LRFD §3.14.5.1

Ps = 8.15 · V · √DWT

Result: 13,040 kip

The §3.14 empirical formula gives the equivalent static head-on force for a vessel of given deadweight tonnage striking the pier at speed V (knots); it governs pier stem and footing design directly.

Kinetic energy available for collision

KE = ½ · (DWT·2000) · V(ft/s)² / g

Result: 226,531,697 ft-kip

Comparing kinetic energy to the fender/pier absorbed energy shows whether the structure or a sacrificial fender system needs to absorb the impact — the basis for choosing pier geometry versus dolphins.

Leaf dead-load moment about the trunnion

M_leaf = W · a

Result: 134,400 kip-ft

This is the overturning moment the counterweight and machinery must balance to hold the leaf in any partially-open position without runaway motion.

Counterweight balancing moment

M_cw = Wcw · acw

Result: 53,100 kip-ft

The counterweight arm is intentionally short and heavy so the leaf can be balanced within the available pit depth; this moment must be within a few percent of the leaf's own moment.

Balance ratio, M_cw / M_leaf

BR = M_cw / M_leaf

Result: 0.3951

A properly balanced leaf sits at BR ≈ 1.00–1.05 (slightly leaf-heavy so the leaf seats firmly closed); values far from unity mean the operating machinery — not the girders — becomes the controlling design element.

Annual frequency of collapse, AF

AASHTO LRFD §3.14.5

AF = N · PA · PG · PC

Result: 0.4875 events/yr (×10⁻³ shown as decimal)

AF combines the number of vessel transits with the probabilities of aberrancy, geometric collision and pier collapse given a hit; a critical bridge like this one targets AF ≤ 0.0001, so the pier protection scheme is sized to that target, not to the raw impact force alone.

Stage 3 · Engineering judgement

For this channel pier, which load case most often governs the foundation depth in the Potomac's soft sediments?

4 points

If your computed balance ratio (M_cw / M_leaf) comes out at 1.35, what does that indicate?

4 points

The computed AF exceeds the 0.0001 target for a critical bridge. What is the correct AASHTO §3.14 response?

4 points

Why is a bascule bridge described as 'two structures — a bridge and a machine'?

4 points

The bascule leaf girders are designated fracture-critical. What follows from that designation?

4 points

Stage 4 · Conclusion

Summarize your recommendation for this pier and leaf: does the vessel-collision check and balance ratio pass as configured, what change (if any) would you specify, and why — referencing the numbers you computed above.

0 / 120 characters minimum
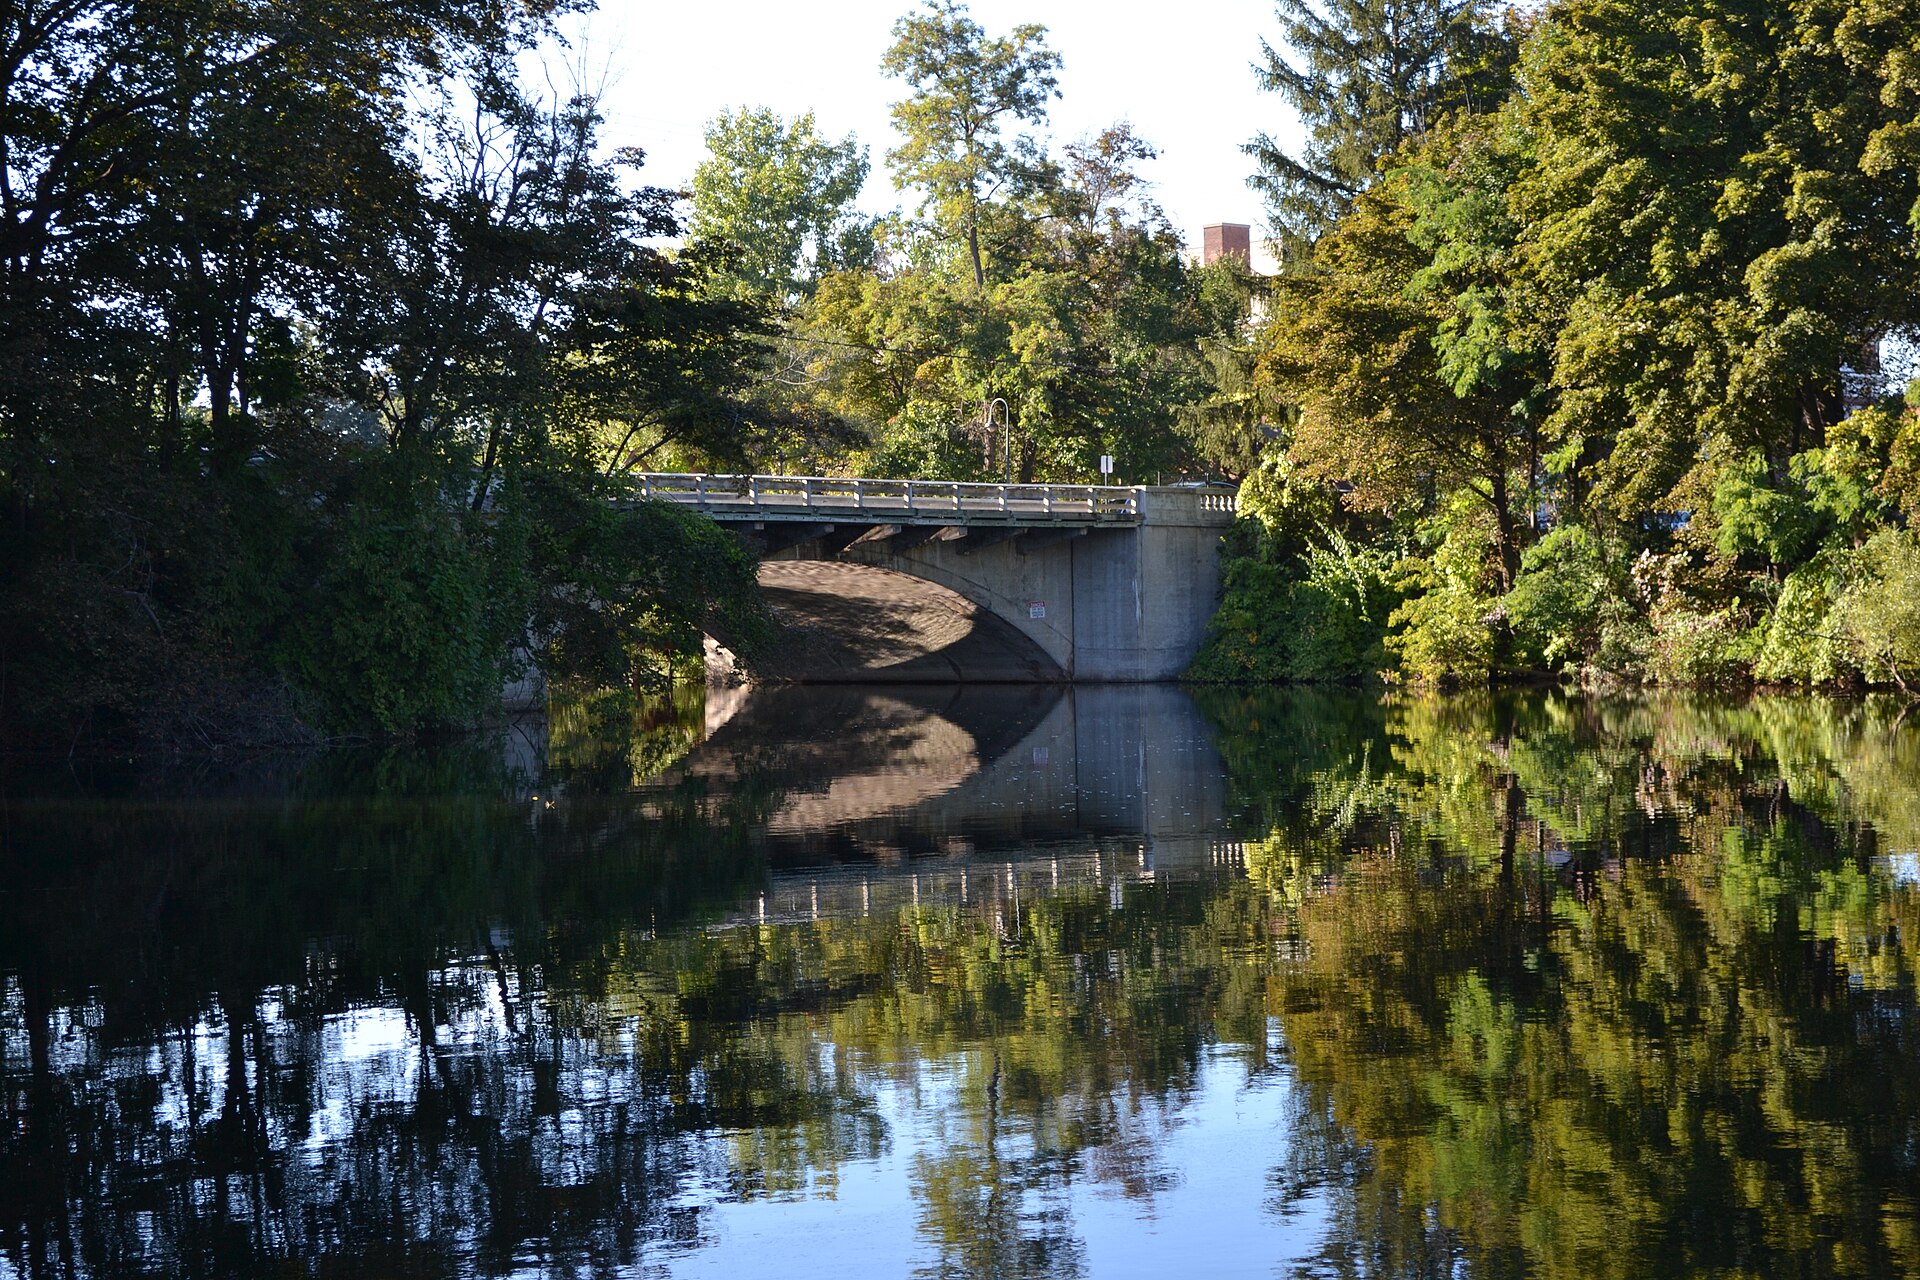
American Legion Memorial Bridge (I-495 over the Potomac)

The American Legion Bridge carries the Capital Beltway between Montgomery County, MD and Fairfax County, VA — the busiest crossing of the Potomac.

Photo: Wikimedia Commons

American Legion Memorial Bridge (I-495 over the Potomac)

Chapters 4, 10, 11, 19

Opened

1962 (widened 1990s)

Length

≈ 1,440 ft

Superstructure

continuous steel plate girders

Lanes

10–12 with planned managed lanes

ADT

≈ 235,000 vpd

A 1960s continuous steel-girder crossing being evaluated for replacement/widening under a bi-state managed-lanes programme. It is the cleanest available teaching example of load rating an existing structure and of the difference between the original ASD design and a modern LRFR rating.

Loads & analysis that govern

  • Original design used AASHO HS20-44 and working-stress allowables; the current evaluation uses LRFR with HL-93 and the state legal and permit trucks (MBE §6A).
  • Continuity means negative-moment regions govern: the deck is in tension over the piers, so §5.6.7 crack control and §6.10.4.2 flange-stress limits both apply there.
  • Live-load distribution recomputed with §4.6.2.2.2 for the widened cross-section — adding lanes changes S, the multiple-presence factor and the exterior-girder lever-rule check simultaneously.
  • Fatigue evaluation per §6.6.1.2 using the fatigue truck with the measured ADTT, not the design assumption — after 60 years the accumulated cycle count is the whole question.

Detailing decisions

  • Original cover-plated flanges are Category E/E′ fatigue details; their terminations are the priority inspection locations.
  • Cross-frames and lateral bracing on the widened units were re-detailed to avoid welding connection plates directly to tension flanges (the Hoan lesson).
  • Deck replacement in stages under traffic — each stage is a separate composite-section analysis because the effective flange width changes with the stage geometry (§4.6.2.6).

Deterioration & rehabilitation

  • Deck joint leakage has driven bearing and girder-end corrosion; section loss at the girder web-to-bearing region is measured and deducted in the rating.
  • Pier-cap cracking from restrained thermal movement of the fixed bearings.
  • Traffic-management constraints mean nearly all work is night-and-weekend staged, which shapes what details are even feasible.

AASHTO references

  • AASHTO LRFD MBE §6A
  • AASHTO LRFD §4.6.2.2
  • AASHTO LRFD §6.6.1.2
  • AASHTO LRFD §6.10.4

Takeaway: Rating an existing bridge is not designing a new one backwards. You measure the section that exists, use the traffic that actually crosses it, and check the details the original code never considered.

Interactive design workflow

The American Legion Bridge's continuous steel-girder unit was widened in the 1990s. You are re-rating one interior girder line for the current lane configuration under LRFR, and checking whether the original cover-plate detail still has fatigue life remaining.

Objective: Recompute the §4.6.2.2.2 moment distribution factor for the widened cross-section, apply it to the HL-93 moment demand, and evaluate the Category E′ cover-plate detail against the measured ADTT for remaining fatigue life.

Stage 1 · Set the parameters

Spacing after widening

From influence-line analysis for this span

Stage 2 · Computed steps

Longitudinal stiffness parameter, Kg

AASHTO LRFD §4.6.2.2.1

Kg ≈ n·(I + A·eg²) [approximated for a typical rolled/plate girder]

Result: 568,121 in⁴

Kg captures how the girder's bending stiffness relative to the deck spreads live load transversely; wider or deeper girders draw more load into a single line.

Interior girder moment distribution factor (2+ lanes)

AASHTO LRFD §4.6.2.2.2b

DF = 0.075 + (S/9.5)^0.6 · (S/L)^0.2 · (Kg / (12·L·ts³))^0.1

Result: 0.6193 lanes/girder

This is the governing §4.6.2.2.2b formula for interior girders with two or more design lanes loaded; because it was recalibrated for the post-widening spacing S, it directly reflects how adding lanes redistributes moment onto each girder line.

Factored girder design moment from live load

AASHTO LRFD §3.6.2

M_u = 1.75 · DF · M_LL · (1+IM/100)

Result: 2,667 kip-ft

The Strength I live-load factor (1.75) and the 33% dynamic load allowance (IM) are applied to the per-lane truck moment after it has been distributed to a single girder line by DF.

Single-lane ADTT for fatigue

AASHTO LRFD §3.6.1.4

ADTT_SL = p · ADTT (p ≈ 0.80 for one lane each direction on a wide facility)

Result: 2,560 trucks/day

Fatigue truck frequency is based on the single-lane truck traffic, not total ADTT, since fatigue accumulates per girder from the trucks actually traveling in the lane over it.

Stress-range cycles per year, N

AASHTO LRFD §6.6.1.2.5

N = 365 · n · ADTT_SL

Result: 934,400 cycles/yr

n is the number of stress-range cycles per truck passage (taken as 1.0 for this simply-continuous span length range per Table 6.6.1.2.5-2).

Constant-amplitude fatigue threshold, (ΔF)TH for Category E′

AASHTO LRFD §6.6.1.2.5

(ΔF)TH = 2.6 ksi (Category E′ per Table 6.6.1.2.5-3)

Result: 2.6 ksi

Category E′ covers the cover-plate-end detail — the worst common fatigue category in AASHTO — reflecting the severe stress concentration at a welded plate termination on a tension flange.

Estimated years of finite fatigue life remaining

AASHTO LRFD §6.6.1.2.5

Years = A / (N · Δf³), A = 1.2×10¹⁰ ksi³ for Category E′

Result: 53.89 years

This finite-life check governs whenever the effective stress range exceeds (ΔF)TH; if Δf were below threshold the detail would have effectively infinite life instead, which is the key judgement call in the rubric below.

Stage 3 · Engineering judgement

After widening added two more lanes, the interior girder DF increased. What is the direct engineering consequence?

4 points

Your computed effective stress range Δf is compared to (ΔF)TH = 2.6 ksi. If Δf is below (ΔF)TH, what does the finite-life calculation above actually tell you?

4 points

Why is the original cover-plate termination a Category E′ detail rather than something more forgiving like Category B?

4 points

What is the key philosophical difference between the original 1960s ASD design and today's LRFR evaluation of this same girder?

4 points

During staged deck replacement, why must each construction stage be analyzed as its own composite section rather than reusing the final-condition analysis?

4 points

Stage 4 · Conclusion

State your rating conclusion for this girder line: does the distributed live-load moment fit within capacity, is the cover-plate detail in the finite- or infinite-life regime given your inputs, and what would you recommend to the owner?

0 / 120 characters minimum

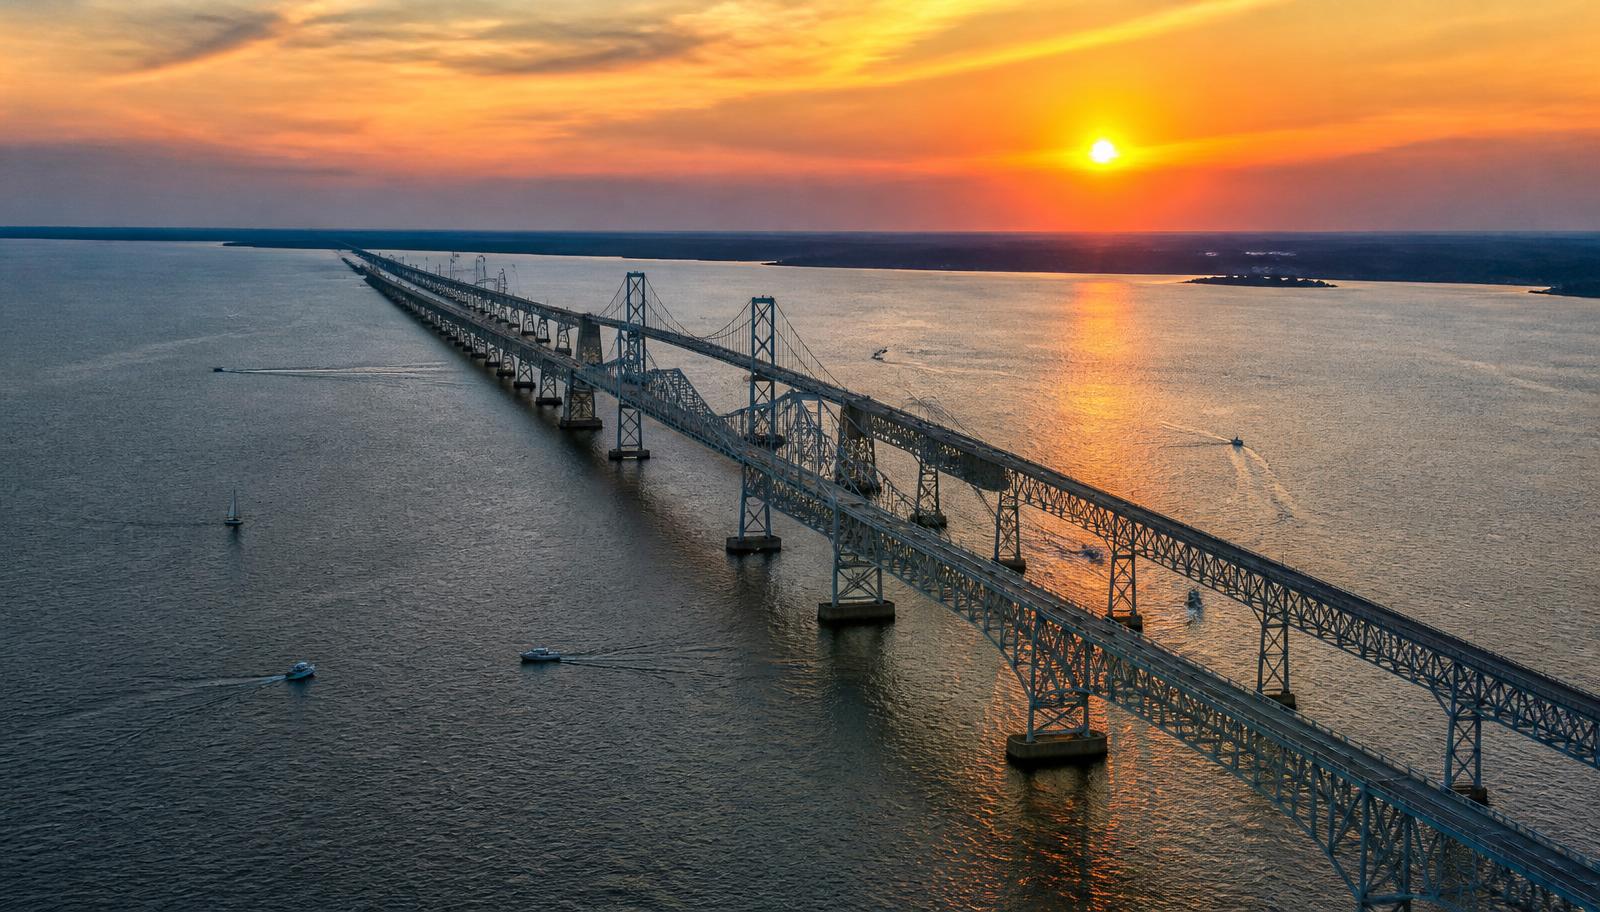
Chesapeake Bay Bridge (US 50/301, William P. Lane Jr. Memorial)

Twin parallel structures — a 1952 two-lane span and a 1973 three-lane span — crossing 4.3 miles of open Chesapeake Bay with suspension and through-truss main units.

Photo: project image library

Chesapeake Bay Bridge (US 50/301, William P. Lane Jr. Memorial)

Chapters 2, 16, 17, 19

Length

4.35 miles (each structure)

Main span

1,600 ft suspension

Secondary main

through-truss, 1,304 ft

Vertical clearance

186 ft at the main channel

Structures

two, built 21 years apart to different codes

Two bridges side by side, designed two decades apart, exposed to identical wind, ice, salt and vessel traffic. That natural experiment makes it the best available illustration of how code evolution changes both the design and the maintenance burden.

Loads & analysis that govern

  • Wind governs operations as much as design: the bridge closes above sustained 55 mph, and the suspension unit required aeroelastic evaluation under §3.8.3 principles.
  • Ice loading per §3.9 on the marine piers — the Bay ices intermittently, so ice is a real Extreme Event II component, not a formality.
  • Vessel collision per §3.14 on the deep-draft channel piers; the traffic includes container and bulk vessels bound for Baltimore, so the fleet data drives the AF calculation.
  • Two-way live-load reversal: the 1952 structure runs contraflow during peak periods, so both spans must be rated for loading patterns their designers never drew.

Detailing decisions

  • Suspension-cable inspection uses wedging and internal-wire sampling; the cable is a non-redundant tension element with no visual failure warning (the Silver Bridge lesson applied preventively).
  • Open steel grid deck on parts of the older structure — light, but a fatigue-detail and skid-resistance liability.
  • Orthotropic and lightweight-concrete deck replacements have been used where dead-load capacity on the suspension unit is the binding constraint.

Deterioration & rehabilitation

  • Marine splash-zone corrosion of the truss lower chords and pier reinforcement is the dominant deterioration mode.
  • Fatigue of riveted and welded connections in the 1952 truss, evaluated against measured ADTT.
  • Dehumidification of the main cables — now standard practice on US suspension bridges — is the highest-value single intervention.

AASHTO references

  • AASHTO LRFD §3.8
  • AASHTO LRFD §3.9
  • AASHTO LRFD §3.14
  • AASHTO LRFD §6.6.2
  • AASHTO LRFD MBE §6

Takeaway: On a long marine crossing, the environment writes the maintenance programme and dead load is the currency you spend on everything else. Every pound added to the deck comes out of live-load capacity on a suspension span.

Interactive design workflow

You are evaluating whether the 1952 suspension span's deck cross-section needs a full aeroelastic wind-tunnel study, using the §3.8 base wind pressure and a slenderness screening consistent with the lesson of Tacoma Narrows.

Objective: Compute the §3.8 design wind pressure on the superstructure, the resulting lateral force per unit length, and the deck span-to-depth and width-to-depth ratios that flag aeroelastic sensitivity.

Stage 1 · Set the parameters

3-second gust, 700-yr MRI per §3.8.1.1

Function of B/D ratio per §3.8.1.2.1

Stage 2 · Computed steps

Design wind speed at deck elevation

AASHTO LRFD §3.8.1.1

VDZ = 2.5·V0·(V/VB)·ln(Z/Z0) [simplified as V·Kz below]

Result: 117.84 mph

The basic 3-second gust speed is adjusted upward for the exposure category and height above the water surface, since the deck of a 1,600-ft suspension span sits well above typical terrain-exposure assumptions.

Design horizontal wind pressure, PD

AASHTO LRFD §3.8.1.2

PD = 0.00256 · Kz · G · Cd · V²

Result: 42.3 psf

This is the ASCE-derived base pressure equation adopted by §3.8: pressure scales with the square of wind speed, so the difference between a 100-mph and 130-mph design event is not linear — it is nearly a 70% increase in force.

Lateral wind force per foot of span, w

w = PD · D

Result: 465.33 lb/ft

Multiplying the pressure by the exposed structural depth gives the distributed lateral load the towers, cables and wind-tongue bracing must ultimately resist.

Total lateral wind force on main span

W = w · L

Result: 744.53 kip

Summed over the full 1,600-ft main span, this is the total lateral demand the cable system and tower saddles must carry into the anchorages — illustrating why cable and tower sizing on a long suspension span is often wind-controlled, not traffic-controlled.

Span-to-depth ratio, L/D

L/D

Result: 145.45

Tacoma Narrows had L/D ≈ 350 with a shallow plate-girder deck; modern practice treats L/D above roughly 200 combined with a solid (non-truss) deck as a flag for detailed aeroelastic study, since deck torsional stiffness scales poorly with span growth.

Width-to-depth ratio, B/D

B/D

Result: 3.09

A low B/D (narrow, deep-relative deck) is more prone to torsional flutter; a stiffening truss deck like the 1952 span's open-grid truss cross-section behaves very differently from a shallow plate-girder box of the same width.

Simplified flutter screening index, FSI

FSI = (L/D) / (B/D) = L/B

Result: 47.06

This ratio of span to deck width is a coarse, first-pass screening number used to decide whether a section-model wind-tunnel study is warranted before committing to a final deck cross-section — it is not a substitute for the actual aeroelastic analysis, only a trigger for ordering one.

Stage 3 · Engineering judgement

On this 1,600-ft suspension main span, which load type most often governs cable and tower sizing?

4 points

Your computed L/D ratio is well above 200 and the deck uses an open-truss stiffening system rather than a shallow solid girder. What should this combination trigger?

4 points

The 1952 and 1973 spans sit side by side under identical wind exposure. What does comparing them primarily teach?

4 points

Why is dehumidification identified as the highest-value single maintenance intervention for the main cables?

4 points

Why does replacing an open steel-grid deck with an orthotropic or lightweight-concrete deck matter specifically on the suspension unit?

4 points

Stage 4 · Conclusion

Based on your computed wind pressure, total force and slenderness ratios, state whether you would recommend proceeding without further aeroelastic study, and justify the decision using the numbers above.

0 / 120 characters minimum

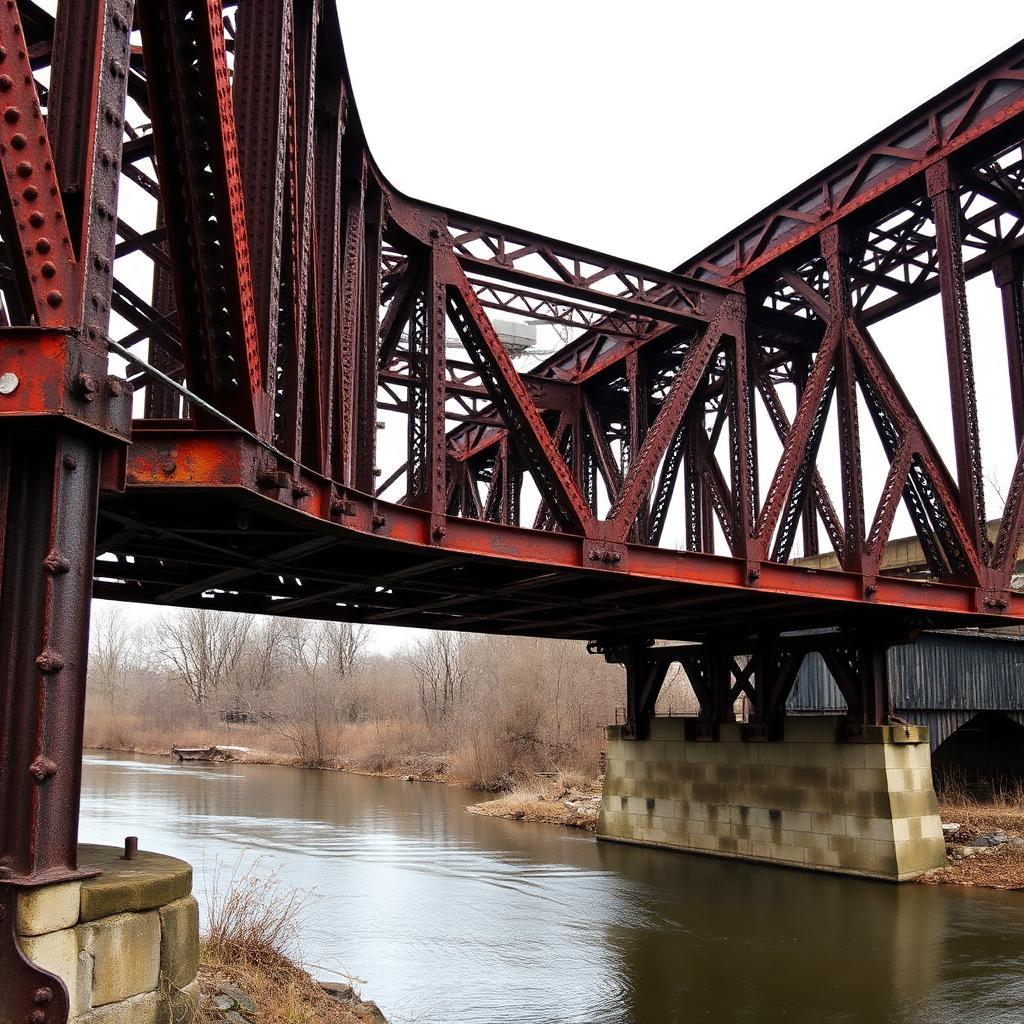
Thomas J. Hatem Memorial Bridge (US 40 over the Susquehanna, MD)

A riveted steel through-truss of the same 1930s–1940s generation as the Hatem. Load rating and rehabilitation of this structural family is a core skill for any Mid-Atlantic bridge engineer.

Photo: project image library — representative riveted through-truss of the Hatem era

Thomas J. Hatem Memorial Bridge (US 40 over the Susquehanna, MD)

Chapters 10, 11, 19

Opened

1940

Length

≈ 1.4 miles

Superstructure

riveted steel deck and through trusses

Lanes

4 (narrow, no shoulders)

Deck

replaced with lightweight system

An 85-year-old riveted truss carrying modern traffic on a toll crossing. Everything interesting about it is an evaluation problem: what is the capacity of a riveted built-up member with section loss, and how much dead load can the truss afford for a new deck?

Loads & analysis that govern

  • Load rating by LRFR (MBE §6A) with the state legal loads; riveted built-up members are checked as bolted members with rivet shear values from MBE Table 6A.6.12.5.1-1.
  • Section loss from corrosion is measured and deducted — the rating is computed on the remaining section, not the drawing section.
  • Deck replacement is a dead-load trade: an exodermic or lightweight-concrete deck buys live-load capacity that the truss cannot otherwise supply.
  • Wind on the through-truss portal and sway frames per §3.8; the narrow deck means vehicle wind loads (§3.8.1.3) are relatively significant.

Detailing decisions

  • Riveted gusset plates are rated as elements — the direct application of the I-35W lesson to a bridge of exactly this vintage.
  • Pack rust between built-up plates jacks the rivets and is a primary inspection finding; measure it, do not just note it.
  • Fracture-critical designation for the truss tension members drives 24-month hands-on inspection.

Deterioration & rehabilitation

  • Chloride-driven corrosion at deck-joint locations and along the lower chord where debris collects.
  • Fatigue category is governed by riveted details (Category C/D), which are more forgiving than welded cover plates but not immune.
  • Toll-plaza and approach settlement produce ride-quality complaints that mask, and sometimes signal, structural movement.

AASHTO references

  • AASHTO LRFD MBE §6A.6.12
  • AASHTO LRFD §3.8
  • AASHTO LRFD §6.6.2
  • AASHTO LRFD §6.13

Takeaway: For a historic truss, capacity is a measurement problem and dead load is a budget. Every rehabilitation decision is a negotiation between the two.

Interactive design workflow

You are evaluating a riveted lower-chord tension member on the Hatem-era through-truss for remaining fatigue life, and judging whether its fracture-critical designation is still warranted given the truss's load-path redundancy.

Objective: Compute the remaining fatigue life of the riveted tension detail using the measured stress range and traffic, and decide whether system redundancy or member criticality should drive the inspection interval.

Stage 1 · Set the parameters

Measured or computed at the critical rivet hole

Typical 1930s–40s carbon steel

Stage 2 · Computed steps

Remaining net section area after loss

An = Agross · (1 − section loss %)

Result: 16.28 in²

The rating is always computed on the section that exists today, not the drawing section — corrosion and pack rust between built-up plates reduce the effective area the rivets must transfer.

Remaining tensile capacity of the member

AASHTO LRFD MBE §6A.6.12

Pn = φy · Fy · An

Result: 510.38 kip

Yielding of the gross-to-net transition and rivet bearing/shear are both checked; this step gives the yielding-based capacity used as the baseline for the load rating factor.

Stress cycles per year, N

AASHTO LRFD §6.6.1.2.5

N = 365 · n · ADTT_SL

Result: 346,750 cycles/yr

Riveted built-up members are checked as Category C or D details, which are more fatigue-resistant per cycle than modern welded cover plates, but the truss has already accumulated decades of cycles at this rate.

Estimated cycles already accumulated

N_total = N · years in service

Result: 29,473,750 cycles

This is a coarse estimate assuming roughly constant traffic over the service life; real assessments would weight earlier decades' lower traffic more carefully, but it establishes the order of magnitude of cumulative damage.

Constant-amplitude fatigue threshold for Category C detail

AASHTO LRFD §6.6.1.2.5

(ΔF)TH = 10 ksi (Category C, riveted connection, per Table 6.6.1.2.5-3)

Result: 10 ksi

Riveted connections are typically classified Category C or D, both substantially more fatigue-tolerant than the E/E′ welded cover-plate details found on the same-era welded girders elsewhere in the network.

Estimated years of finite fatigue life remaining

AASHTO LRFD §6.6.1.2.5

Years = [A/(N·Δf³)] − years already in service, A = 4.4×10¹⁰ ksi³ (Category C)

Result: 1,062 years

Subtracting years already in service from the total finite-life estimate gives the remaining service life at the detail if the measured stress range and traffic hold roughly constant going forward — a negative result signals the detail should already be in the infinite-life regime or under close monitoring.

Approximate LRFR rating factor for this member

AASHTO LRFD MBE §6A.4

RF = (Pn − γDC·DC) / (γLL·LL·(1+IM)) [simplified: RF ∝ Pn]

Result: 1.51

A simplified proxy rating factor (normalized against an assumed factored demand of 250 kip) shows whether the measured section loss has already eroded the member below RF = 1.0 for legal loads — the trigger for load posting or member replacement.

Stage 3 · Engineering judgement

Why are riveted built-up members from the 1930s–40s often more fatigue-tolerant per cycle than welded cover-plate details from the 1960s–70s?

4 points

What is the technical basis for designating a truss tension member as fracture-critical?

4 points

Why does pack rust between built-up plates matter enough to be a primary inspection finding rather than a cosmetic note?

4 points

If your computed 'remaining years of finite fatigue life' comes out negative, what is the correct engineering interpretation?

4 points

Why is a lightweight or exodermic deck replacement described as 'buying' live-load capacity on this truss?

4 points

Stage 4 · Conclusion

Given your computed remaining fatigue life and rating factor, state whether this member's fracture-critical inspection interval should stay at 24 months, be shortened, or whether member replacement should be recommended, and justify using your numbers.

0 / 120 characters minimum

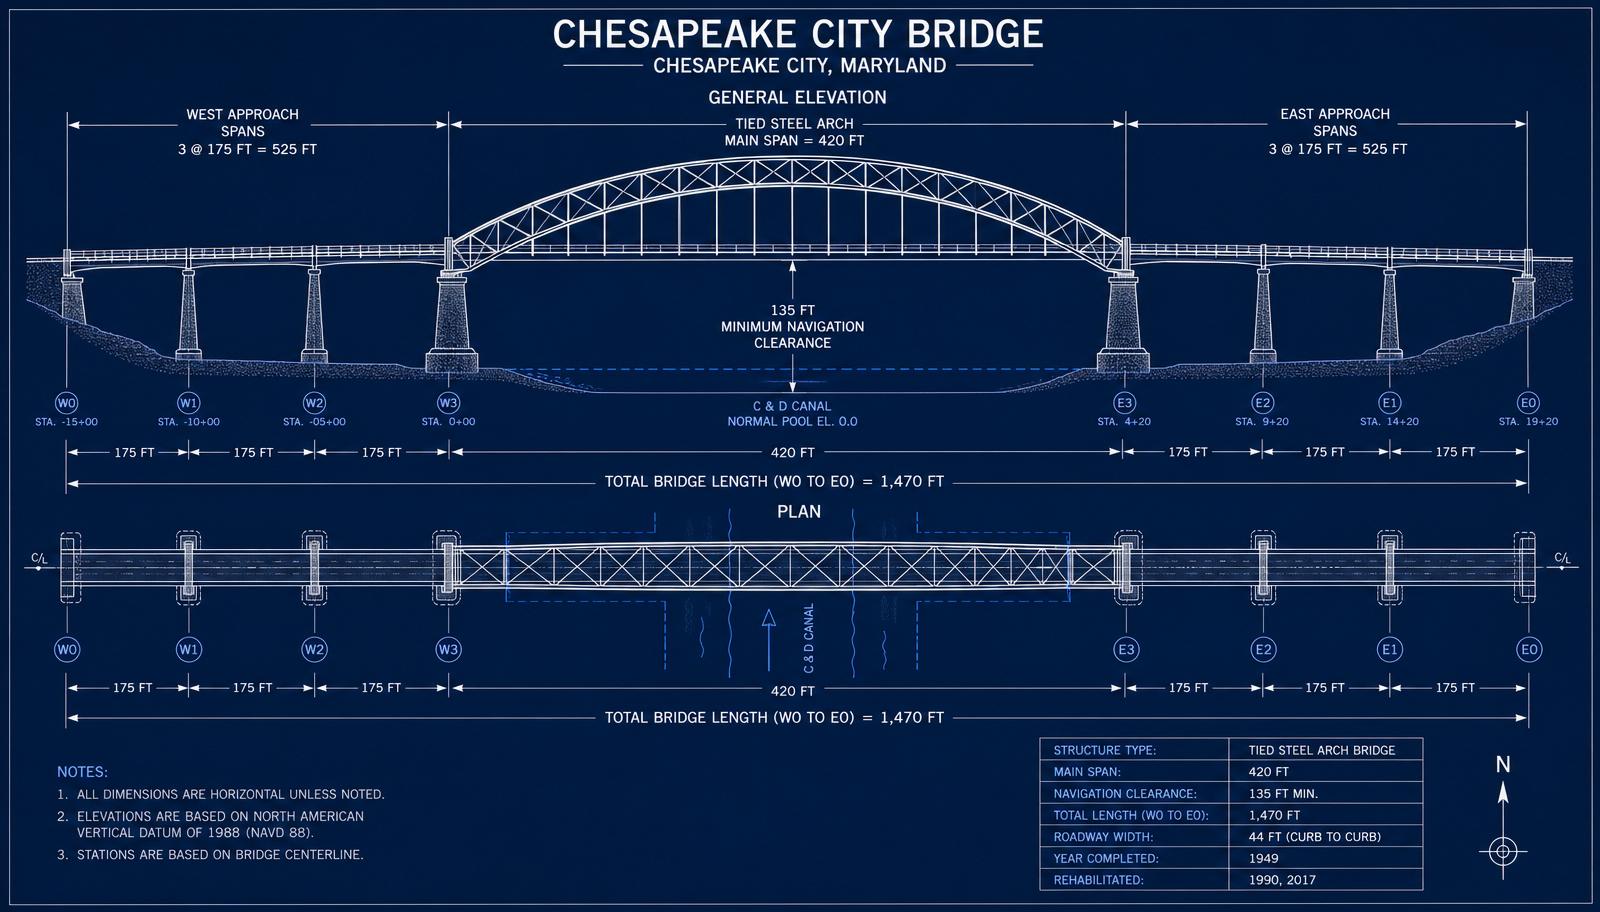
Chesapeake City Bridge (MD Route 213 over the C&D Canal)

The tied-arch over the Chesapeake & Delaware Canal — a high-level fixed replacement for a vertical-lift bridge that a ship destroyed in 1942.

Photo: project image library

Chesapeake City Bridge (MD Route 213 over the C&D Canal)

Chapters 2, 3, 11, 16

Opened

1949

Main span

540 ft steel tied arch

Vertical clearance

135 ft over the canal

Waterway

C&D Canal (USACE deep-draft)

Structure type

tied arch with suspended deck

This bridge exists because its predecessor — a vertical-lift span — was struck and destroyed by a tanker in 1942. The response was not a stronger lift bridge; it was to remove the structure from the navigation envelope entirely. That is the vessel-collision hierarchy in physical form.

Loads & analysis that govern

  • The tie girder is the critical tension element: the arch thrust is resolved internally, so the tie carries the full horizontal component and its loss is catastrophic.
  • Hanger forces come from an influence-line analysis — each hanger has its own loading pattern for maximum force, which is the cleanest teaching example of influence lines on a real structure (§3.6.1).
  • Vessel collision is designed out rather than resisted: 135 ft clearance and piers set back from the channel, the preferred first step of the §3.14 protection hierarchy.
  • Wind on the arch rib and hangers, plus the vortex-shedding check on the slender hangers themselves, which have very low mass and damping.

Detailing decisions

  • Tie girders on this generation of arch are typically fracture-critical; several US tied arches have been retrofitted with redundancy plates or post-tensioning after tie cracking was found.
  • Hanger connections are fatigue-sensitive: pinned or socketed details with defined inspection and replacement provisions.
  • Corrosion protection of the arch rib interior is a design decision — sealed and dehumidified, or accessible and painted.

Deterioration & rehabilitation

  • Aesthetic and corrosion-protection maintenance dominate; the tied-arch form is exposed on every surface.
  • Hanger replacement is planned as a staged operation with temporary hangers — a live structural analysis problem, since removing one hanger redistributes force to its neighbours.
  • Deck and joint replacement must respect the tie girder's fracture-critical status: no field welding to the tie.

AASHTO references

  • AASHTO LRFD §3.6.1
  • AASHTO LRFD §3.14
  • AASHTO LRFD §6.6.2
  • AASHTO LRFD §6.10

Takeaway: The best vessel-collision design is to put the structure where ships cannot reach it. And in a tied arch, the tie is the whole bridge — treat it accordingly.

Interactive design workflow

You are checking whether the tied-arch's pier foundations, set back from the C&D Canal navigation channel, have adequate embedment below the computed local scour depth under the design flood/tidal-flow event.

Objective: Compute the HEC-18 local pier scour depth and compare it to the available embedment below the pier footing to confirm foundation adequacy under Extreme Event II conditions.

Stage 1 · Set the parameters

Depth at the pier under design flow

1.0 for round-nosed pier

Stage 2 · Computed steps

Approach Froude number, Fr1

Fr1 = V1 / √(g·y1)

Result: 0.1978

The Froude number characterizes the balance between inertial and gravity forces in the approach flow, which directly controls how vigorously the flow can scour around an obstruction like a pier.

Angle-of-attack correction factor, K2

AASHTO LRFD HEC-18 Eq. 6.3

K2 = (cosθ + (L/a)·sinθ)^0.65

Result: 1.21

Even a small skew between the flow direction and the pier's long axis dramatically increases the effective obstruction width the flow sees, which is why K2 grows quickly with both angle and pier elongation.

Bed-condition correction factor, K3

AASHTO LRFD HEC-18 Table 6.4

K3 = 1.1 (small dunes, typical tidal/estuarine bed)

Result: 1.1

K3 accounts for the bedform regime; the tidal, sediment-laden C&D Canal environment is represented here by a small-dune bed condition, a common assumption absent site-specific bed survey data.

Local pier scour depth, ys

AASHTO LRFD HEC-18 (FHWA HEC-18, referenced via §2.6.4.4.2)

ys = 2.0·K1·K2·K3·a^0.65·y1^0.35·Fr1^0.43

Result: 15.62 ft

This is the standard HEC-18 clear-water/live-bed local pier scour equation; note it caps in practice at ys/a ≈ 2.4 for Fr1 ≤ 0.8, so the raw formula result should always be checked against that envelope for reasonableness.

Resulting scour elevation below original mudline

Elev_scour = ys (measured from existing bed)

Result: 15.62 ft below mudline

This depth defines the new effective ground surface the foundation must be checked against for both bearing and lateral capacity — everything above this elevation is assumed to contribute no resistance during the design flood/tidal event.

Residual footing embedment below the scour line

Residual = TotalEmbedment − ys

Result: 22.38 ft

A positive residual embedment with adequate margin (engineers typically want several diameters/widths of pile or shaft still engaged below scour) confirms the foundation retains adequate bearing and lateral capacity in the scoured condition; a small or negative value means the foundation must be deepened or protected.

Footing exposure check (is the footing itself undermined?)

Exposure = ys − footingTop

Result: 9.62 ft

If this value is positive, the scour hole reaches below the top of the footing itself, meaning the footing is directly exposed to flow and must be checked for undermining, not just the piles/shafts beneath it — a materially more severe condition than pure pile-embedment loss.

Stage 3 · Engineering judgement

The Chesapeake City replacement bridge set its piers back from the navigation channel entirely. How does this relate to the scour calculation above?

4 points

Your K2 factor grows quickly as the angle of attack θ increases, especially for an elongated pier (large L/a). What is the practical design implication?

4 points

Why is scour analysis at a tidal canal crossing like the C&D Canal treated differently from a typical riverine crossing?

4 points

If your 'footing exposure' step comes out positive (scour reaches below the top of footing), what is the correct engineering response?

4 points

The case's takeaway states 'the tie is the whole bridge.' How does that relate to the foundation scour check you just performed?

4 points

Stage 4 · Conclusion

Report whether the computed scour depth leaves adequate residual embedment and whether the footing itself is exposed, and recommend whether countermeasures or a deeper foundation are warranted, referencing your computed values.

0 / 120 characters minimum

Cases with confirmed forensic findings — collapses and near-misses — are in the Failure Library , and the long-form narratives are in Engineering stories .

Bridge Engineering and Design Using AASHTO LRFD

Graduate interactive textbook for civil engineering students. Aligned to AASHTO LRFD Bridge Design Specifications, 10th Edition (2024).

Regional focus

Maryland & Mid-Atlantic — MDOT SHA, VDOT, PennDOT, FHWA.

Educational notice

This educational application supplements, but does not replace, the official AASHTO LRFD Bridge Design Specifications, applicable state DOT manuals, project specifications, and professional engineering judgment.

© 2026 Dr. Steve Efe, Ph.D. All Rights Reserved.

Developed for engineering education. Unauthorized reproduction, distribution, or commercial use is prohibited.

v1.0 · Reference edition · Aligned to AASHTO LRFD, 10th Edition (2024)