SE

This educational application supplements, but does not replace, the official AASHTO LRFD Bridge Design Specifications, applicable state DOT manuals, project specifications, and professional engineering judgment.

Failure Library

Real bridges. Real consequences.

Every AASHTO provision has a history — usually a costly one. Each case below gives the failure mechanism, the numbers behind it, the warning signs that were available beforehand, and the checks that exist today because of it. Sources are NTSB, FHWA, ASCE and peer-reviewed forensic literature.

8

documented collapses & near-misses

1907–2024

span of the record

6

AASHTO articles traced to these events

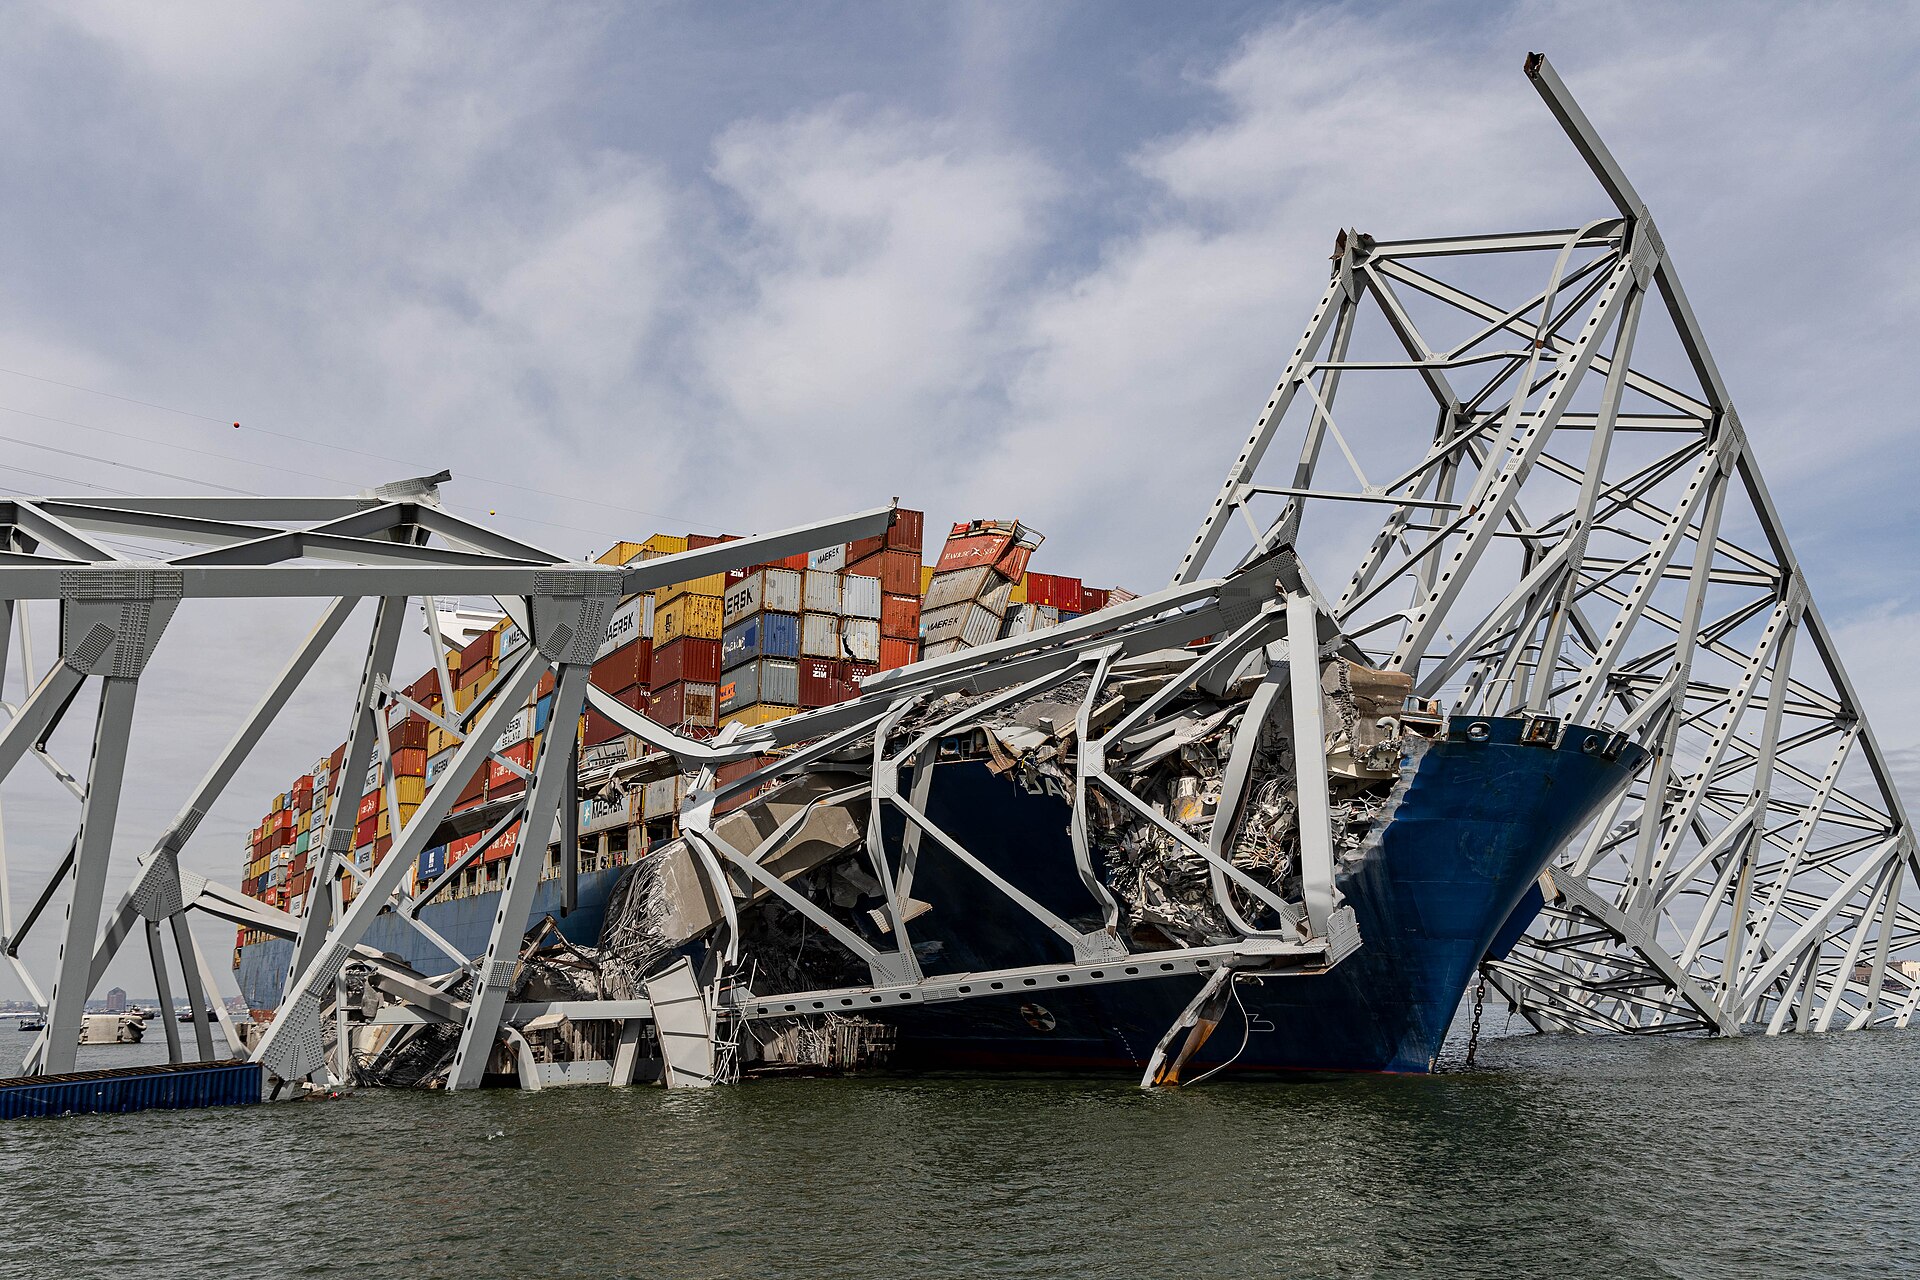
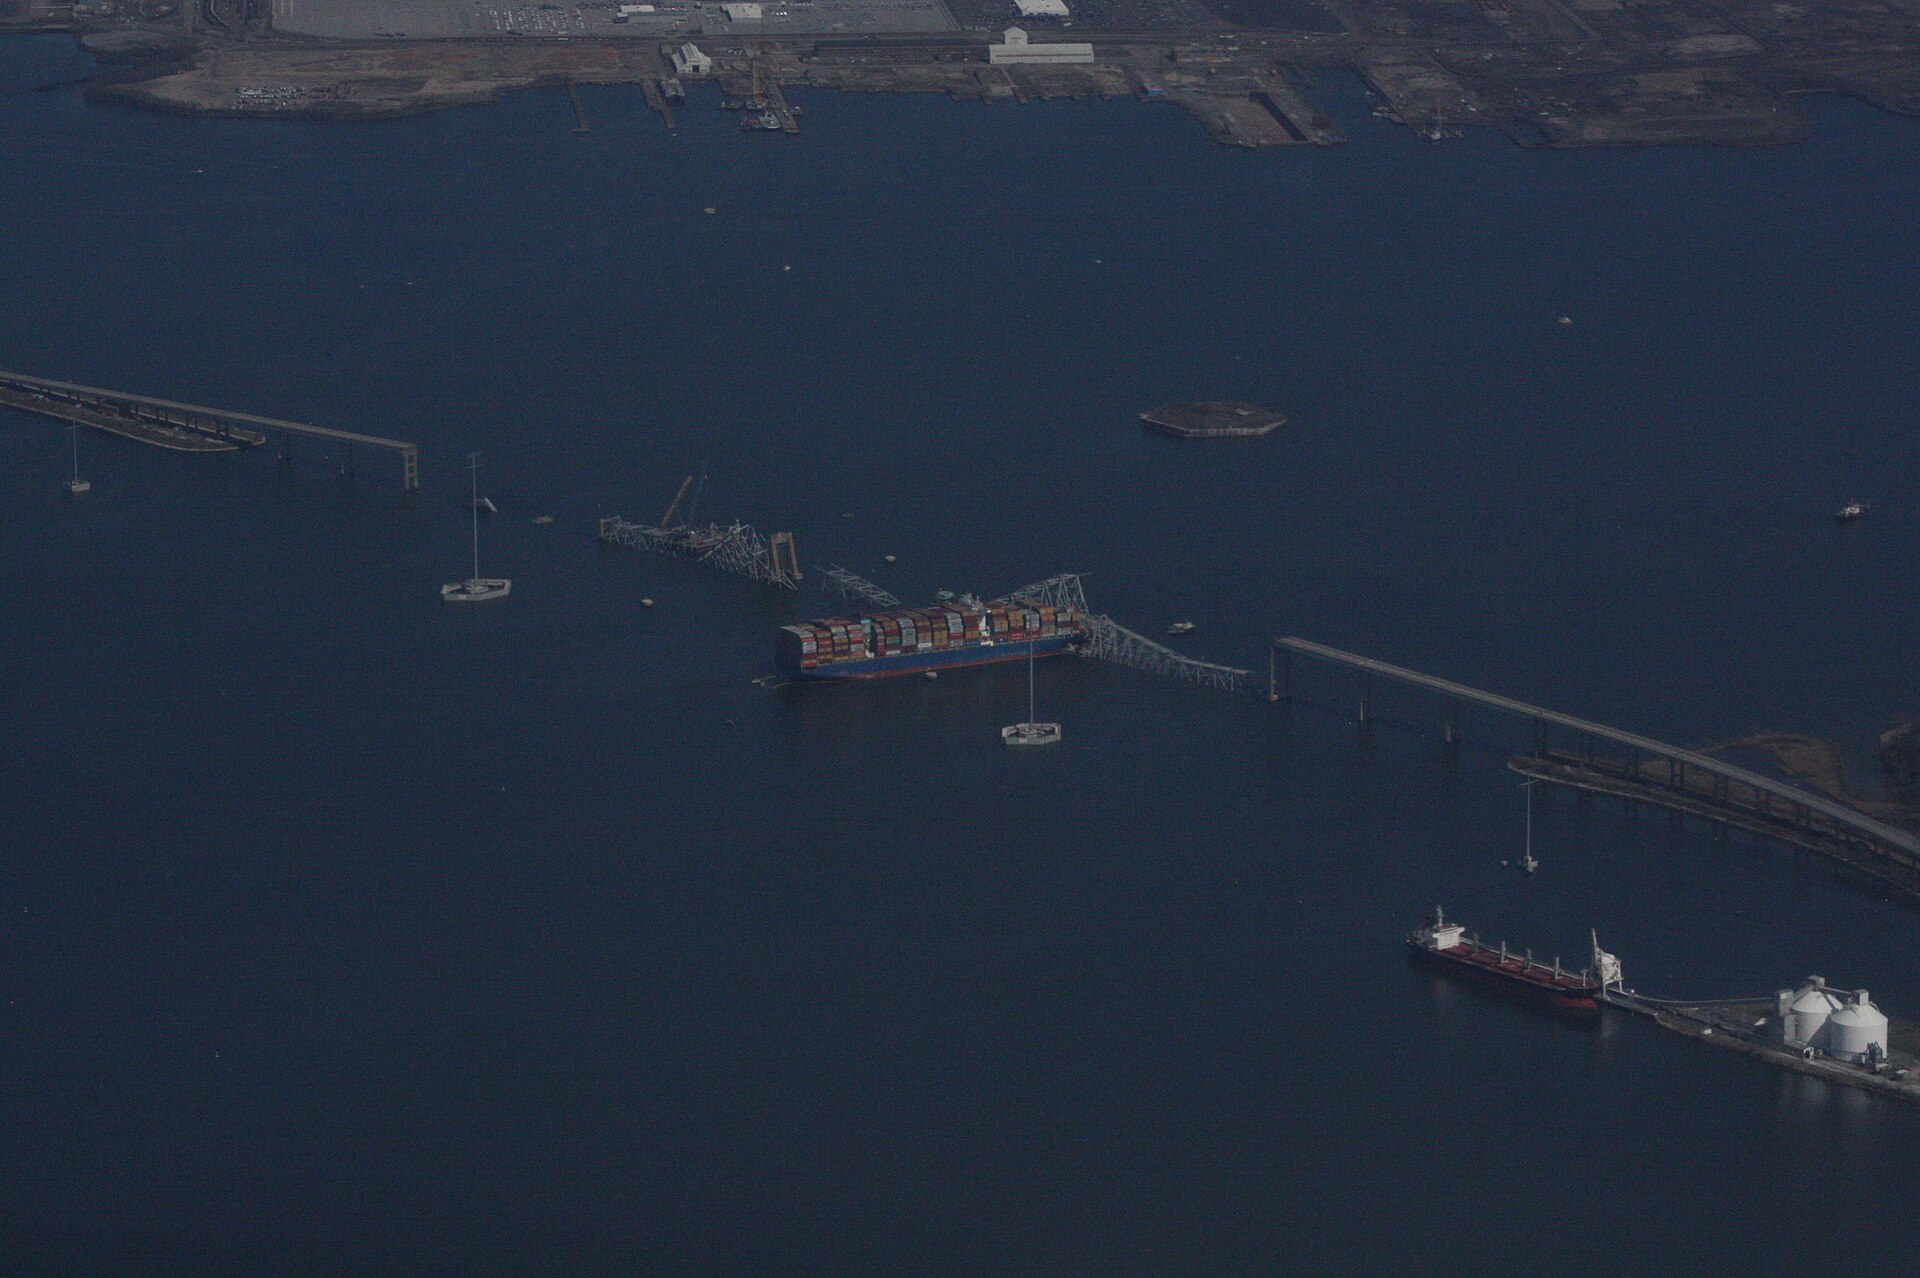
Francis Scott Key Bridge (I-695, Baltimore, MD) — 26 March 2024

The Key Bridge main span in the Fort McHenry channel. One unprotected pier carried the cantilever arm; when it disappeared, the whole main unit went with it.

Photo: U.S. Army Corps of Engineers / Wikimedia Commons (public domain)

Francis Scott Key Bridge (I-695, Baltimore, MD)

26 March 2024

Continuous steel through-truss, cantilever main span (1,200 ft), non-redundant

6 fatalities
AASHTO LRFD §3.14Chapter 16

Failure mechanism: Vessel collision → substructure removal → progressive collapse of a statically non-redundant superstructure.

What happened: The 116,000-DWT container ship Dali lost electrical power, went off-track in the channel and struck the south main-span pier at roughly 8 knots. The pier had timber-and-concrete fenders sized for a 1970s design vessel and no dolphins or protective island.

Vessel DWT

≈ 116,000 tonnes

Impact speed

≈ 8 knots (4.1 m/s)

Equivalent static force §3.14.5

order 10⁵ kips

Time to full collapse

≈ 20 seconds

Design year

1972–77 (pre-§3.14)

Warning signs that were available

  • Design-era vessel fleet was a fraction of today's displacement; the collision envelope was never revisited in 47 years of service.
  • The bridge was classified fracture-critical but the substructure vulnerability was outside the scope of routine FCM inspection.
  • No progressive-collapse (pier-removal) study existed for the cantilever unit.

Checks you run today

  • Compute the annual frequency of collapse AF = N · PA · PG · PC and compare to 0.0001 (critical) / 0.001 (regular).
  • Size dolphins, islands or fender systems for the design vessel's kinetic energy, not for a nominal force.
  • Run a pier-removal analysis: if losing one substructure unit takes the whole crossing, the protection requirement rises accordingly.

Design lesson: Vessel-collision energy on aging non-redundant piers can vastly exceed the design envelope of the era. Re-evaluate every major waterway crossing under current AASHTO §3.14 using present-day AIS fleet data, and prefer physical protection over pier strengthening.
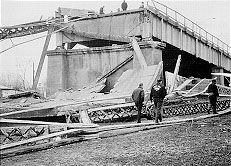
I-35W Mississippi River Bridge (Minneapolis, MN) — 1 August 2007

The I-35W deck truss in the Mississippi. The failure originated in a connection — a half-inch gusset plate — not in any main member.

Photo: U.S. Navy / Wikimedia Commons (public domain)

I-35W Mississippi River Bridge (Minneapolis, MN)

1 August 2007

Steel-deck-truss main span (458 ft), non-load-path-redundant

13 fatalities
AASHTO LRFD §6.14Chapter 11

Failure mechanism: Gusset-plate instability (Whitmore-section buckling) under accumulated dead load plus construction surcharge.

What happened: The U10 gusset plates were detailed at 1/2 in where 1 in was required — a 1965 design-office error that was never independently checked. Forty years of resurfacing added roughly 20% dead load, and 383 tons of construction aggregate and equipment sat directly over the node on the day of collapse.

U10 plate thickness provided

0.5 in

Thickness required

≈ 1.0 in

Added dead load 1967→2007

≈ 20%

Construction surcharge over U10

≈ 383 tons

Collapse duration

≈ 4 seconds

Warning signs that were available

  • Inspection photographs from 1999 onward showed visible out-of-plane bowing of the U10 plates; no procedure required a capacity calculation.
  • Load ratings recognised members but not connections — the gussets were never rated.
  • The staging plan placed material over the most highly stressed node with no written load limit.

Checks you run today

  • Rate gusset plates as elements: gross/net yield, block shear, Whitmore yield and Whitmore buckling, shear on critical planes, fastener capacity (MBE §6A.6.12).
  • Re-rate after every overlay, barrier upgrade or utility attachment on a non-redundant truss.
  • Require an engineered, written and posted limit for any construction load placed on an in-service structure.

Design lesson: Non-load-path-redundant connections require independent capacity checks. Original design errors compound with decades of added deck weight and inspection blind spots.

Silver Bridge (Point Pleasant, WV — Ohio River) — 15 December 1967

The Silver Bridge in the Ohio River. A 0.12-inch flaw inside an eyebar eye ended a 700-ft main span in under a minute.

Photo: U.S. federal government / Wikimedia Commons (public domain)

Silver Bridge (Point Pleasant, WV — Ohio River)

15 December 1967

Eyebar-chain suspension, two bars per joint (fully non-redundant)

46 fatalities
AASHTO LRFD §6.6.2Chapter 17

Failure mechanism: Stress-corrosion cracking → brittle fracture of a non-redundant tension member → instantaneous collapse.

What happened: Hydrogen-assisted stress-corrosion cracking initiated in the bore of eyebar 330 at joint C13N, in a crevice that could not be seen or cleaned. At 0 °F the heat-treated 1035 steel had a fracture toughness near 25 ksi·√in, so the critical crack size was smaller than anything visual inspection could find.

Initiating flaw depth

≈ 0.12 in

Eyebars per joint

2 (loss of one = loss of joint)

Service temperature

≈ 0 °F

Estimated K_IC

≈ 25 ksi·√in

Fracture to collapse

< 60 seconds

Warning signs that were available

  • No hands-on inspection of the chain joints had ever been performed — the eyebar bores were physically inaccessible.
  • The 1927 steel had no toughness specification of any kind.
  • Redundancy was never evaluated as a design property; the chain was treated as adequate because stresses were low.

Checks you run today

  • Maintain an FCM inventory with hands-on, arm's-length inspection at 24-month intervals (23 CFR 650 Subpart C).
  • Specify Charpy V-notch toughness by temperature zone and fracture-critical status per AASHTO §6.6.2.
  • Prefer internally redundant built-up members; four bars per joint changes the consequence of one fracture entirely.

Design lesson: Non-redundant, fracture-critical members demand elevated inspection access and material toughness. This collapse created the National Bridge Inspection Standards.

Schoharie Creek Bridge (I-90, NY Thruway) — 5 April 1987

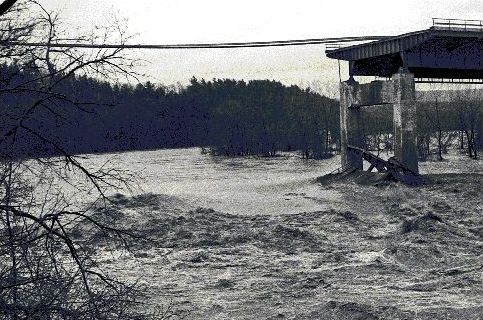
Two spans of the New York Thruway in Schoharie Creek. The superstructure was intact; the ground under pier 3 was not.

Photo: Wikimedia Commons (public domain)

Schoharie Creek Bridge (I-90, NY Thruway)

5 April 1987

Simple-span steel plate girders on reinforced-concrete pier walls

10 fatalities
AASHTO LRFD §2.6.4Chapter 14

Failure mechanism: Local scour of a spread footing on erodible soil during a flood → pier rotation → loss of bearing → span drop.

What happened: Pier 3 rested on a shallow spread footing founded on soil, protected only by a dry riprap blanket that had washed away years earlier and was never replaced. The 1987 flood produced a scour hole several feet deep beneath the upstream footing edge; the pier tipped and two spans dropped.

Flood recurrence

≈ 50-year event (not extreme)

Footing type

spread footing on soil, no piles

Scour depth at failure

several ft below footing

Spans lost

2

Warning signs that were available

  • Underwater inspection was not part of the routine programme; the riprap loss was invisible from the deck.
  • The design assumed riprap would remain in place for the life of the bridge — a maintenance assumption embedded in a structural design.
  • There was no scour-critical rating or plan of action for flood events.

Checks you run today

  • Design for the design flood (Q₁₀₀) at Strength/Service and check the Q₅₀₀ event at Extreme Event II per AASHTO §3.7.5 and §2.6.4.4.
  • Compute contraction plus local pier scour; found below the total scour depth or use piles bearing below it.
  • Assign a scour-critical rating (NBI Item 113) and a written plan of action for scour-critical bridges.

Design lesson: Scour is a foundation limit state, not a maintenance topic. Extreme-flood combinations must design foundations for the check flood (Q₅₀₀) with the scour hole assumed present.

Tacoma Narrows Bridge (WA) — 7 November 1940

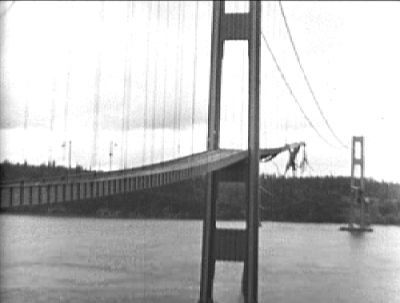
The Narrows deck after the collapse. The stiffening girders that were meant to make the deck rigid were the very feature that made it a bluff aerodynamic body.

Photo: Washington State Archives / Wikimedia Commons (public domain)

Tacoma Narrows Bridge (WA)

7 November 1940

Plate-girder-stiffened suspension, 2,800 ft main span, L/d = 350

AASHTO LRFD §3.8Chapter 16

Failure mechanism: Aeroelastic torsional flutter — a self-excited, negatively damped instability, not a resonance with gust frequency.

What happened: An extremely slender, torsionally open H-section deck. Vortices shed by the solid stiffening girders locked in with the fundamental antisymmetric torsional mode, and beyond a critical wind speed of roughly 35–42 mph the aerodynamic damping went negative.

Span/depth ratio

350 (Golden Gate ≈ 85)

Wind speed at failure

≈ 42 mph

Torsional amplitude

> 45°

Design wind treatment

static 30 psf pressure

Warning signs that were available

  • The deck oscillated visibly from the day it opened in July 1940 and was nicknamed 'Galloping Gertie' by its own users.
  • Tie-down cables installed to damp the motion snapped and were treated as a maintenance nuisance.
  • The design's slenderness was known to be unprecedented; no comparable structure existed to calibrate against.

Checks you run today

  • Wind-tunnel test any deck with L/d above ~150 or a fundamental frequency below 1 Hz.
  • Check flutter, vortex-induced vibration, galloping and buffeting as separate limit states (AASHTO §3.8.3, §C4.6.5).
  • Use torsionally closed sections (box girders) or vented/grated open decks to raise the critical flutter speed.

Design lesson: Wind is not a static load. Long-span and flexible bridges require aeroelastic evaluation, usually including section-model wind-tunnel testing.

Quebec Bridge (St. Lawrence River, QC) — 29 August 1907 (and again 11 September 1916)

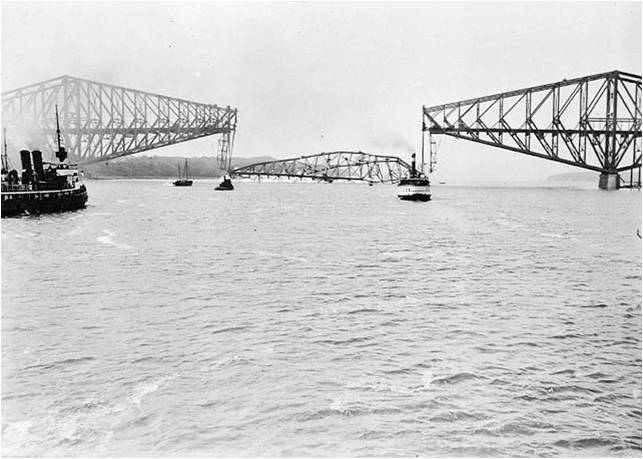
The Quebec Bridge cantilever after the 1907 collapse. The failure is the reason the engineering profession in North America treats compression-member design and design review the way it does.

Photo: Wikimedia Commons (public domain)

Quebec Bridge (St. Lawrence River, QC)

29 August 1907 (and again 11 September 1916)

Riveted steel cantilever truss, 1,800 ft main span

75 fatalities
AASHTO LRFD §6.9.4Chapter 18

Failure mechanism: Buckling of built-up latticed compression chords whose dead load had been under-estimated and never re-checked after the span was lengthened.

What happened: The span was increased from 1,600 ft to 1,800 ft after the dead-load estimate was fixed; the actual weight exceeded the assumed weight by roughly 20%. The lower-chord compression members were latticed built-up sections whose lacing could not develop the required composite action, and the consulting engineer approved continued erection after visible deflection was reported.

Main span

1,800 ft (world record attempt)

Dead-load underestimate

≈ 20%

Lives lost 1907

75

Lives lost 1916 (span drop)

13

Warning signs that were available

  • Chords A9L and A9R were measured out of straight by up to 2¼ in weeks before the collapse; erection continued.
  • The dead-load calculation was never revised after the fundamental change in span length.
  • One engineer held approval authority with no independent check of the governing members.

Checks you run today

  • Design built-up compression members for the modified slenderness that accounts for shear deformation of the lacing (AASHTO §6.9.4.3).
  • Re-run the dead-load take-off after any geometry change, however late in the project.
  • Treat measured out-of-straightness during erection as a stop-work trigger until it is evaluated in writing.

Design lesson: Compression members fail by stability, not strength, and stability is exquisitely sensitive to initial imperfection. Independent design review of governing members is not bureaucracy — it is the control that catches single-point errors.

Koror–Babeldaob Bridge (Palau) — 26 September 1996

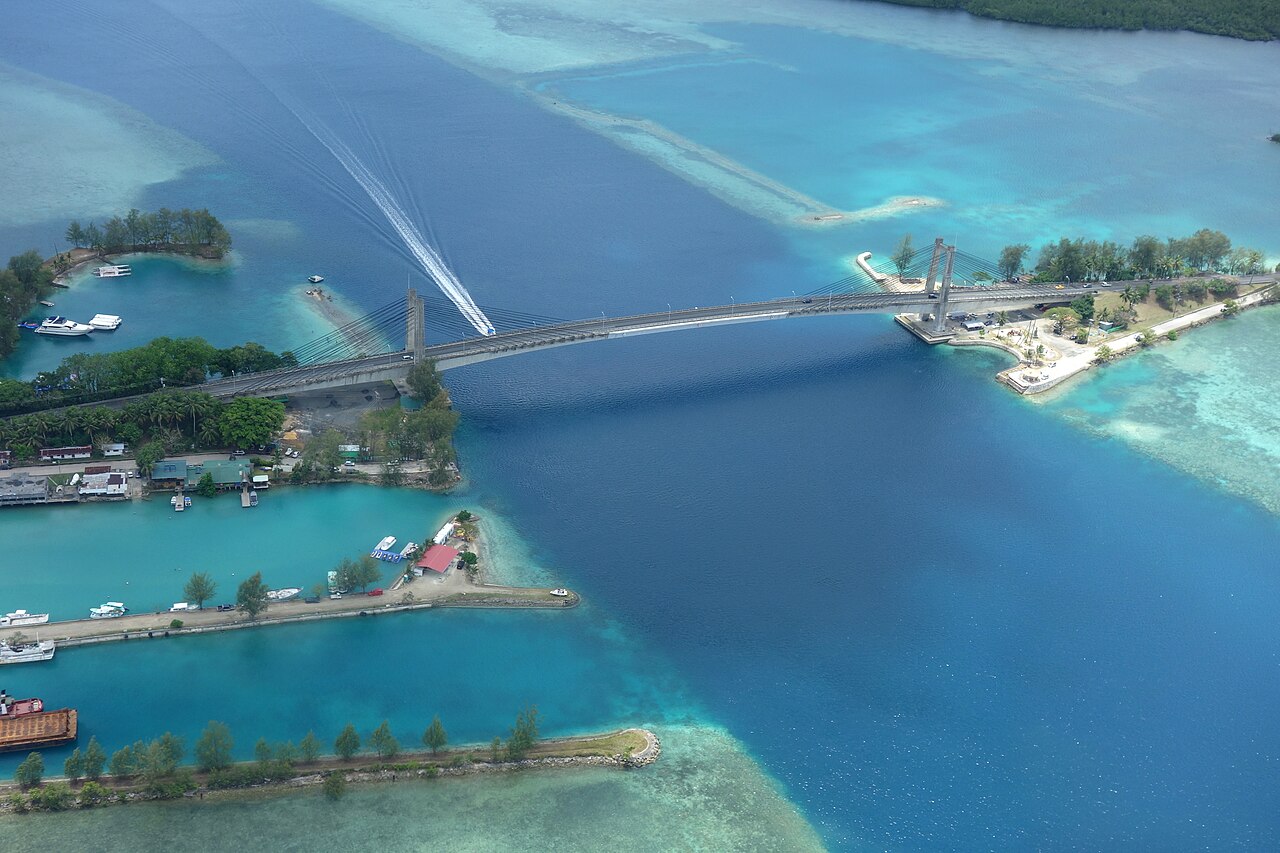
The Koror–Babeldaob Bridge, at the time the longest concrete box-girder span in the world. It failed 19 years after opening, three months after a retrofit intended to correct its deflection.

Photo: Wikimedia Commons (public domain)

Koror–Babeldaob Bridge (Palau)

26 September 1996

Prestressed-concrete segmental balanced-cantilever box girder, 241 m main span

AASHTO LRFD §5.9.3Chapter 18

Failure mechanism: Excessive long-term creep and shrinkage → prestress loss → progressive midspan sag → shear/compression failure at the hinge after an ill-conceived retrofit.

What happened: Midspan sagged 1.2 m over 18 years — roughly double any prediction — because creep of the lightweight-aggregate concrete and time-dependent prestress loss were badly under-modelled. The 1996 retrofit added external post-tensioning and a bituminous overlay, which increased compressive stress in the already-distressed top slab near the pier; failure followed within three months.

Main span

241 m (world record at completion)

Midspan sag by 1990

≈ 1.2 m

Predicted sag

≈ 0.6 m

Time from retrofit to collapse

≈ 3 months

Warning signs that were available

  • The deflection was measured and documented for nearly two decades and treated as a serviceability annoyance rather than evidence of a modelling error.
  • The retrofit was designed without a time-dependent analysis of the structure in its current, distressed state.
  • No instrumentation was installed to monitor stress redistribution during or after the retrofit.

Checks you run today

  • Use a realistic creep/shrinkage model (AASHTO §5.4.2.3) with materials testing for record spans, and run staged time-dependent analysis.
  • Compute refined prestress losses per §5.9.3.4 rather than the approximate method for unusual geometry or lightweight concrete.
  • Before any strengthening retrofit, back-analyse the structure so the model reproduces the measured deflections; then design the retrofit on that model.

Design lesson: Time-dependent behaviour governs long-span prestressed concrete. When measured deflection departs from prediction, the model is wrong — and any retrofit must be designed against the measured state, not the as-designed state.

FIU Pedestrian Bridge (Miami, FL) — 15 March 2018

The FIU–Sweetwater span across SW 8th Street. It had been in place five days, cracks had been photographed for two, and traffic was still running underneath.

Photo: Wikimedia Commons (public domain)

FIU Pedestrian Bridge (Miami, FL)

15 March 2018

Post-tensioned concrete truss placed by SPMT (accelerated bridge construction)

6 fatalities
AASHTO LRFD §5.7.4Chapter 18

Failure mechanism: Interface (cold-joint) shear failure at the Node 11/12 diagonal-to-deck connection, aggravated by retensioning under live traffic.

What happened: Interface shear demand at the cold joint exceeded the §5.7.4.3 capacity by roughly a factor of two, and the design did not account for the loss of confinement when the temporary erection blister was removed. Retensioning the Member 11 PT bars increased horizontal thrust at exactly the joint that was already failing.

Interface shear demand/capacity

≈ 2.0

Observed crack width

up to 40× acceptable

Days in place before failure

5

Traffic below during retensioning

open

Warning signs that were available

  • Crack photographs were emailed on 13 March; the judgement that they were non-structural was made verbally, without a calculation.
  • The independent peer review did not check the nodal interface shear.
  • The construction-stage model omitted the blister-removal condition, which was the governing case.

Checks you run today

  • Compute V_ni = c·A_cv + μ(A_vf·f_y + P_c) at every construction joint, with the §5.7.4.3 upper limits.
  • Model every erection stage including temporary-support and blister removal.
  • Treat any crack on an incomplete structure as structural until an engineer disproves it in writing; close traffic during PT, jacking or load-transfer operations.

Design lesson: Construction-stage load paths differ from final ones. Peer review, an error-checking culture, and closing traffic during retensioning are non-negotiable.

Longer narratives — with timelines, forensic findings and the code articles each event produced — are in Engineering stories . Full design case files for in-service Mid-Atlantic bridges are in Case studies .

Bridge Engineering and Design Using AASHTO LRFD

Graduate interactive textbook for civil engineering students. Aligned to AASHTO LRFD Bridge Design Specifications, 10th Edition (2024).

Regional focus

Maryland & Mid-Atlantic — MDOT SHA, VDOT, PennDOT, FHWA.

Educational notice

This educational application supplements, but does not replace, the official AASHTO LRFD Bridge Design Specifications, applicable state DOT manuals, project specifications, and professional engineering judgment.

© 2026 Dr. Steve Efe, Ph.D. All Rights Reserved.

Developed for engineering education. Unauthorized reproduction, distribution, or commercial use is prohibited.

v1.0 · Reference edition · Aligned to AASHTO LRFD, 10th Edition (2024)