Engineering story
Tacoma, Sunshine Skyway, and the birth of Extreme Event limits
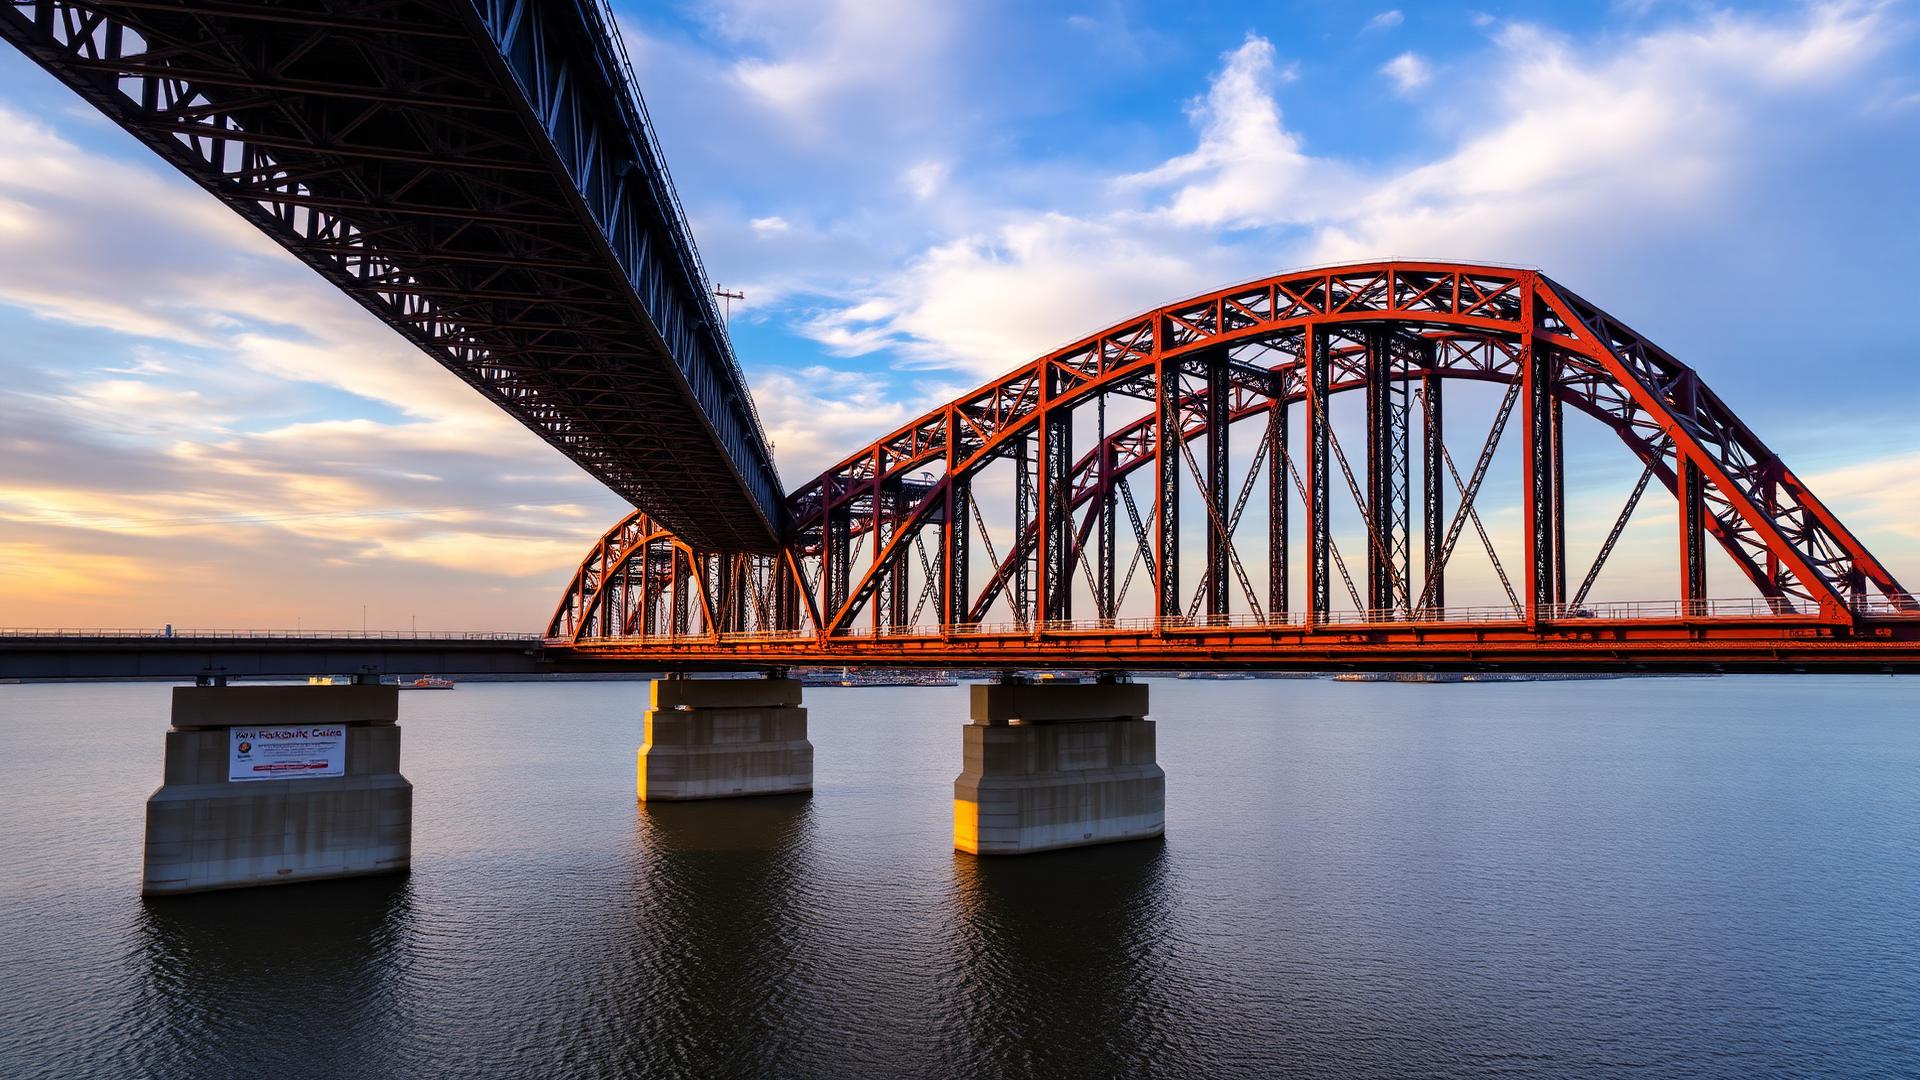
The 1940 collapse of the Tacoma Narrows bridge in a 42 mph steady wind — visible in the world's most-watched engineering film — killed the assumption that wind is a static load and forced bridge engineers to treat long-span decks as elastic oscillators. Forty years later, the 1980 Sunshine Skyway collapse in Tampa Bay — a phosphate freighter struck a pier column in a squall, dropping a 1,200-ft span and 35 people — created what AASHTO now calls the Extreme Event II limit state and forced every navigable waterway crossing to be sized against a defined vessel-impact load.
Chapter objectives
What you will be able to do
Learning objectives
By the end of this chapter you will be able to:
- 1Convert a mapped 3-s gust to design wind pressure P_z on superstructure and substructure (§3.8).
- 2Recognize when vortex shedding, buffeting, or flutter controls a long-span deck and know the aeroelastic screening rules.
- 3Compute the AASHTO Method II vessel-impact force P_B on a pier from vessel DWT and speed (§3.14).
- 4Apply the 600-kip static equivalent vehicular collision load on unprotected columns (§3.6.5).
- 5Combine wind, ice, vessel, and vehicular impact into AASHTO Extreme Event I and II combinations with the proper load factors.
- 6Assemble a simple resilience metric — return period × downtime × cost — for a bridge under multi-hazard exposure.
- 7Deliver two worked examples (wind pressure and barge impact) plus a cable-stayed multi-hazard design challenge.
16.1 — Wind on the structure
Design wind pressure from 3-s gust
AASHTO now uses the ASCE 7 mapped 3-s gust wind speed V for a defined return period (700 yr for Strength III, 1700 yr for Extreme Event I on major bridges). The design pressure at height z is:
- 3-s gust wind speed [mph]
- height/exposure coefficient (Table 3.8.1.2.1-1)
- gust factor (1.0 for typical bridges; 0.85 for long span)
- drag coefficient (1.3 girder + rail, 2.0 truss)
- wind pressure [ksf]
Force per unit length on the superstructure:
where d is the exposed depth of the girder + barrier + parapet.
Wind on live load (WL)
16.2 — Aeroelastic response
Buffeting, vortex shedding, flutter
Wind is not just a static pressure — it is a broadband turbulent flow. Three regimes matter for bridges:
- Static / mean drag: covered by Eq. 16.1.
- Buffeting: random turbulence excitation at the bridge's natural frequencies — checked by gust factor G and dynamic amplification.
- Vortex shedding: lock-in at U = fn B / St; produces resonant vertical/torsional oscillation of slender decks.
- Flutter: negative aerodynamic damping — a self-excited divergent oscillation, cause of Tacoma Narrows.
- Strouhal number (~0.11 typical deck)
- deck depth and width [ft]
- flutter velocity coefficient (5–12) from wind tunnel
- first torsional natural frequency [Hz]
16.3 — Vessel collision (CV)
AASHTO Method II impact force
Every pier within reach of a navigable waterway must resist an equivalent static vessel-impact force PB. AASHTO's Method II calibrates PB from vessel dead-weight tonnage (DWT) and impact velocity:
- impact velocity [ft/s]
- vessel dead-weight tonnage [tonne]
For barges specifically (§3.14.11):
Method II checkpoint
16.4 — Vehicular collision (CT)
600-kip static equivalent
Any pier column within 30 ft of the edge of a roadway (or 50 ft of a railway centerline) must be designed for a 600-kip equivalent static force applied 5 ft above ground unless it is shielded by a Test-Level-5 barrier or has been analysed by refined impact methods.
16.5 — Ice loads
Ice crushing at the water line
Where an ice-covered waterway is present, horizontal ice pressure:
- effective ice crushing strength (8–32 ksf)
- ice thickness [ft]
- width of pier exposed to ice [ft]
- pier nose shape coefficient
16.6 — Extreme-event combinations
Which loads act together
Extreme events are treated one-at-a-time with reduced live-load partners:
- Extreme Event I: γp DC + γEQ LL + 1.0 EQ. Earthquake governs.
- Extreme Event II: γp DC + 0.5 LL + 1.0 CV (or CT, IC, IM, WA). Vessel, vehicle, ice, or scour governs.
- Strength III: γp DC + 1.0 WS (structure). No LL.
- Strength V: γp DC + 1.35 LL + 0.4 WS + 1.0 WL. Live load with concurrent wind.
- Service IV: γp DC + 1.0 WS (cracking/deflection check).
16.7 — Resilience framing
Return periods × downtime × cost
Modern extreme-event design closes with a resilience assessment: annual probability of loss × consequences × recovery time. A fault tree combines the mutually exclusive hazards to bound the expected annual downtime and repair cost:
16.8 — Worked example 1
Design wind pressure on a girder bridge
Problem statement
A steel plate-girder bridge on the Gulf Coast has 130-ft simple spans with 5-ft-deep girders + a 3-ft F-shape barrier (d = 8 ft exposed). Compute the design wind pressure and per-span wind force at the Extreme Event I event.
Given
- 3-s gust wind speed (700-yr)V = 115 mph (Gulf Coast)
- Height of deck (z)40 ft above grade (Exposure C)
- Kz1.09 (Table 3.8.1.2.1-1, Exposure C, z = 40 ft)
- G, CDG = 1.0; C_D = 1.3 (girder + rail)
- Exposed depth d8 ft
Required
Compute P_z, w_WS, span wind force, and the pier overturning moment (deck 20 ft above pier base).
Step 1 — Design pressure (Eq. 16.1).
Formula
Substitute
Result
Step 2 — Line load on the superstructure.
Formula
Substitute
Result
Step 3 — Span wind force delivered to piers.
Formula
Substitute
Result
Step 4 — Pier overturning moment. Deck 20 ft above pier base, plus the pier's own 20-ft column exposed to wind on it (add 0.30 klf approx.):
Formula
Substitute
Result
Step 5 — Combine (Strength III). Apply γ = 1.0 (already 700-yr map) plus γ_p = 1.25 on DC. Check pier P–M capacity — for the multi-column bent designed in Ch. 9, 560 kip-ft is well within the biaxial envelope.
Final section detailing (from computed A_s)
Wind demand on plate-girder bridge (Strength III / Extreme I)
| Location | A_s required | Bars provided | Spacing / detail |
|---|---|---|---|
| 3-s gust V | Gulf Coast map, 700-yr | 115 mph | verify with NOAA WX-DB |
| Pressure P_z | Eq. 16.1 | 48 psf on superstructure | recompute at z = 60 ft for tall piers |
| w_WS | P_z × d | 0.384 klf | add 0.30 klf on pier column |
| Wind on LL (WL) | 0.10 klf @ 6 ft above deck | included in Strength V | not in Strength III |
| Aeroelastic check | not required for L < 200 ft | skipped — girder bridge | required for L > 400 ft |
16.9 — Worked example 2
Vessel impact on a river pier
Problem statement
A river pier is exposed to a 3,000-ton fully loaded jumbo hopper barge with typical transit speed 6 ft/s (4 knots). Compute the AASHTO Method II barge impact force P_B and check the pier.
Given
- DWT3,000 tonne
- V6 ft/s (transit)
- Vessel mass factor K1.05 (hopper barge)
- Bow energy E_H (deformation limit)from AASHTO Fig. 3.14.11-1 ≈ 4,600 kip-ft at V = 6 fps
- Pier4-ft-Ø drilled shaft, 40 ft above waterline
Required
Compute a_B, P_B, and the pier base moment; check whether a sacrificial fender is needed.
Step 1 — Barge damage depth parameter a_B (Eq. 16.5).
Formula
Substitute
Result
Step 2 — Since a_B < 0.34, use linear branch.
Formula
Substitute
Result
Cross-check via Eq. 16.4 (ship form):
Formula
Substitute
Result
Step 3 — Pier base moment. Force applied 5 ft above WSE, pier fixity 40 ft below WSE (drilled shaft):
Formula
Substitute
Result
Step 4 — Combine (Extreme Event II). γ = 1.0 CV + 0.5 LL + 1.0 DC + scour envelope from Ch. 14. Check the 4-ft-Ø drilled shaft P–M capacity — typically requires either a larger shaft or a sacrificial pier-nose fender that dissipates ≥ 30 % of the kinetic energy.
Step 5 — Fender sizing. Kinetic energy of barge:
Formula
Substitute
Result
A rubber-cell fender that absorbs 1,000 kip-ft (30 %) reduces P_B by ~15 % — usually enough to bring pier demand back within capacity.
Final section detailing (from computed A_s)
Barge-impact design of river pier
| Location | A_s required | Bars provided | Spacing / detail |
|---|---|---|---|
| Design vessel | AF ≤ 0.001 (regular) | 3,000-ton hopper barge, V = 6 fps | vessel frequency from lock records |
| P_B (bare pier) | Eq. 16.5 barge form | 304 kip @ 5 ft above WSE | Ext. Event II, γ = 1.0 |
| Base moment | pier P–M envelope | 13,700 kip-ft | requires 6-ft Ø shaft if no fender |
| Fender system | absorb ≥ 30 % KE | 3-cell rubber fender + timber facing | 6 ft from pier face |
| Fender maintenance | inspect after each impact | 5-yr replacement cycle | part of bridge O&M program |
16.10 — Guided practice
Truck-collision retrofit
A single-column pier next to a freeway has Mn = 5,200 kip-ft and shear Vn = 380 kip. Is a Test-Level-5 concrete barrier required, or does the pier resist 600 kip at 5 ft above ground directly?
Expected result
16.11 — Mini design challenge
Multi-hazard: cable-stayed river crossing
Deliver:
- Static wind pressure P_z on deck and tower for the 1,700-yr gust; aeroelastic screening (vortex-shedding and flutter velocity).
- Design vessel selection (from AASHTO §3.14 AF calibration for a "critical" bridge) and computed P_B.
- Extreme Event II combination at the base of the river tower.
- Vehicular collision (§3.6.5) at approach columns — barrier vs. direct design.
- Resilience fault tree — target ≤ 3 closure-days/yr for a lifeline crossing.
- Fender/dolphin plan and a one-page multi-hazard memo.
Submit your design challenge
Upload your extreme-event memo (PDF)
You must be signed in to upload a submission.
Sign in →16.12 — Chapter summary
What you leave with
- Design wind pressure P_z = 2.56×10⁻⁶ V² K_z G C_D (Eq. 16.1) and w_WS = P_z·d for the exposed depth.
- Aeroelastic regimes — buffeting, vortex shedding (f_s = St·V/h), flutter (U_cr = η_c f_n,t B).
- Vessel-impact force P_B by Method II (Eq. 16.5 for barges, Eq. 16.4 for ships), applied at WSE elevation.
- 600-kip vehicular-collision force on unshielded columns, 5 ft above ground.
- Extreme Event I (earthquake) and II (vessel / vehicle / ice) load combinations with γ = 1.0.
- Resilience framing: EAL = Σ P(H) × downtime × cost, and lifeline targets ≤ 3–5 days/yr.
Section 2
Fully Worked Examples
Complete AASHTO LRFD solutions with knowns, assumptions, step calculations, verification, and design commentary. Difficulty rises from basic to consulting-grade.
Worked Example 1
Problem
Step-by-Step
Design Verification
P_s of 20,000–30,000 kip is realistic for major shipping channels (e.g., Sunshine Skyway, Chesapeake Bay Bridge). ✓
Discussion
Vessel-impact design follows AASHTO Vessel Collision Guide (Method II or III). Extreme Event II γ_CV = 1.0. Full probabilistic analysis usually required for interstate river crossings.
Worked Example 2
Problem
Step-by-Step
Design Verification
TL-5 barrier is the standard bridge-pier protection for interstate roadways. Providing it converts the force check into a barrier design check.
Discussion
Never rely on 'unlikely event' arguments. §3.6.5 is a code requirement below 30-ft clear setback; either design for 600 kip or install a rated barrier.
Worked Example 3
Problem
Step-by-Step
Design Verification
Add hydrostatic and buoyancy per §3.7.1 and §3.7.2. For skewed flow use §3.7.3.2 modification.
Discussion
Extreme Event II combines flood + scour + vessel/vehicle simultaneously with reduced γ_LL. See §3.4.1 Table 3.4.1-1 for the full combination.
Section 3
Guided Practice
Complete the missing steps. Use Hints for AASHTO article pointers and setup logic before revealing the full step. Submit at the end to send your work to your instructor.
Guided Problem 1
Bridge exposure C, elevation , 3-s gust design wind , , , .
Design pressure (ksf).
Convert to psf.
Distributed girder wind (klf) for exposed depth .
Total force on 120-ft span (kip).
Guided Problem 2
Unprotected pier < 30 ft from edge of travel way and < 50 ft from centerline of railway. Static equivalent CT load.
AASHTO CT static equivalent design force (kip).
Height of application above ground (ft).
Load combo at Extreme Event II.
Alternative: TL-5 barrier at 3 ft protects pier — CT then reduced to (kip).
Guided Problem 3
Tanker fire under prestressed concrete girder. Cover = 2 in, exposure 60 min at 1832°F (ASTM E119), governed by spall risk at reinforcement temperature.
Approximate temperature at 2-in cover after 60 min per ACI/PCI charts (°F).
Compressive strength retention at 850°F (fraction of ).
Prestress steel strength retention at 850°F (fraction of ).
Recommend action (1 = replace girder, 0 = keep).
Guided Problem 4
Truck bomb 1000 lb TNT equivalent. Column diameter 4 ft. Compute scaled distance and peak reflected pressure at stand-off .
Scaled distance (ft/lb^0.3333333333333333).
Peak reflected pressure (psi) at (Kingery-Bulmash tables).
Total impulse (psi·ms) approx .
Design load classification per DOD guidance for : Category?
Section 4
Independent Practice
Every problem randomizes its inputs. Work each step, submit for immediate feedback, request new values to practice again.
Practice 1
Practice 2
Practice 3
Practice 4
Practice 5
Practice 6
Practice 7
Practice 8
Practice 9
Practice 10
Practice 11
Practice 12