
Engineering story
Squeezing concrete so it never sees tension
Concrete is roughly ten times stronger in compression than in tension. Ordinary reinforced concrete accepts that tension will crack the section and lets the steel pick it up — that works, but service-load cracks admit water and chlorides, and the section stiffness drops the moment the first crack opens. Prestressing solves the same problem differently: we pre-compress the concrete with high-strength strand so that under full service loads the extreme tension fiber still sees compression, or at worst a very small controlled tension. The section stays uncracked, the girder stays stiff, and spans that would be impossible in RC (100–200 ft simple, 300 ft+ continuous) become routine.
This chapter is the AASHTO design workflow for two families: pretensioned precast girders (AASHTO Type II–VI, bulb-tee, box) and post-tensioned cast-in-place or spliced girders. We walk the four stages a girder experiences — at transfer, after all losses, at service with deck and live load, and at ultimate — and check each against AASHTO §5. Every calc follows the Formula → Substitute → Result pattern.
Chapter objectives
What you will be able to do
Learning objectives
By the end of this chapter you will be able to:
- 1Distinguish pretensioned vs post-tensioned construction and select the appropriate system for a given span, depth, and site.
- 2Compute all AASHTO §5.9 prestress losses: elastic shortening, shrinkage, creep, steel relaxation (short and long form).
- 3Check the AASHTO §5.9.2.3 stress limits at transfer and at service (girder-only and composite).
- 4Design flexural strand pattern (straight + harped or debonded) for a simple-span pretensioned girder.
- 5Compute nominal flexural resistance φMₙ using the strain-compatibility / bonded-tendon equations of §5.6.3.1.
- 6Design transverse shear reinforcement using AASHTO §5.7.3 (MCFT), including the harped-strand Vₚ contribution.
- 7Design post-tensioned anchorage-zone bursting reinforcement per §5.9.5.6.
- 8Estimate camber and deflection for release, deck placement, and long-term service.
7.1 — Prestressing systems
Pretension vs post-tension
Two industrial processes produce a prestressed girder. In pretensioning, high-strength strand (typically Grade 270, 7-wire, 0.5 in or 0.6 in diameter) is stressed against fixed abutments in a long precast bed, concrete is cast around the strand, and once concrete reaches release strength f'ci the strand is flame-cut. The prestress transfers to the concrete by bond over a transfer length of about 60 strand diameters. In post-tensioning, the concrete is cast first with hollow ducts in place; after curing the tendons are threaded, jacked from an anchorage plate, locked off with wedges, and the ducts are pressure-grouted.
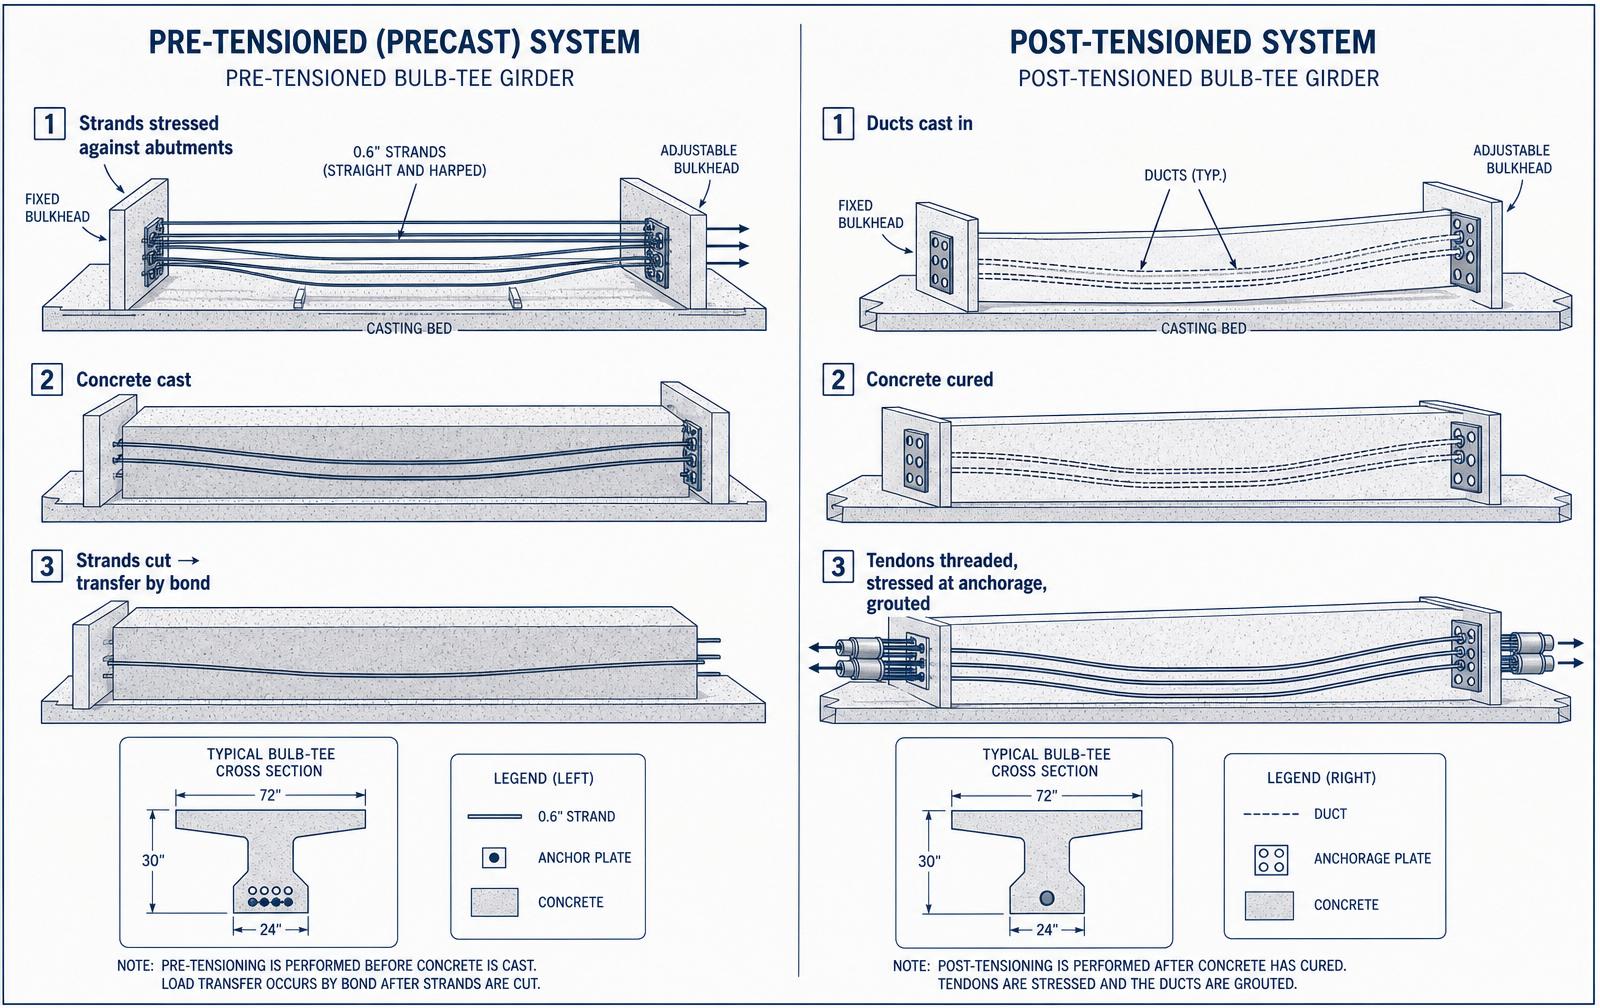
| Attribute | Pretensioned precast | Post-tensioned (CIP or spliced) |
|---|---|---|
| Typical span range | 40 – 160 ft | 120 – 300 ft (continuous) |
| Where prestress is applied | Precast plant | On site, after casting |
| Load transfer mechanism | Bond over transfer length ≈ 60·db | End anchorage plates + wedges |
| Common girder shapes | AASHTO Type II–VI, bulb-tee, box | Spliced bulb-tee, segmental box |
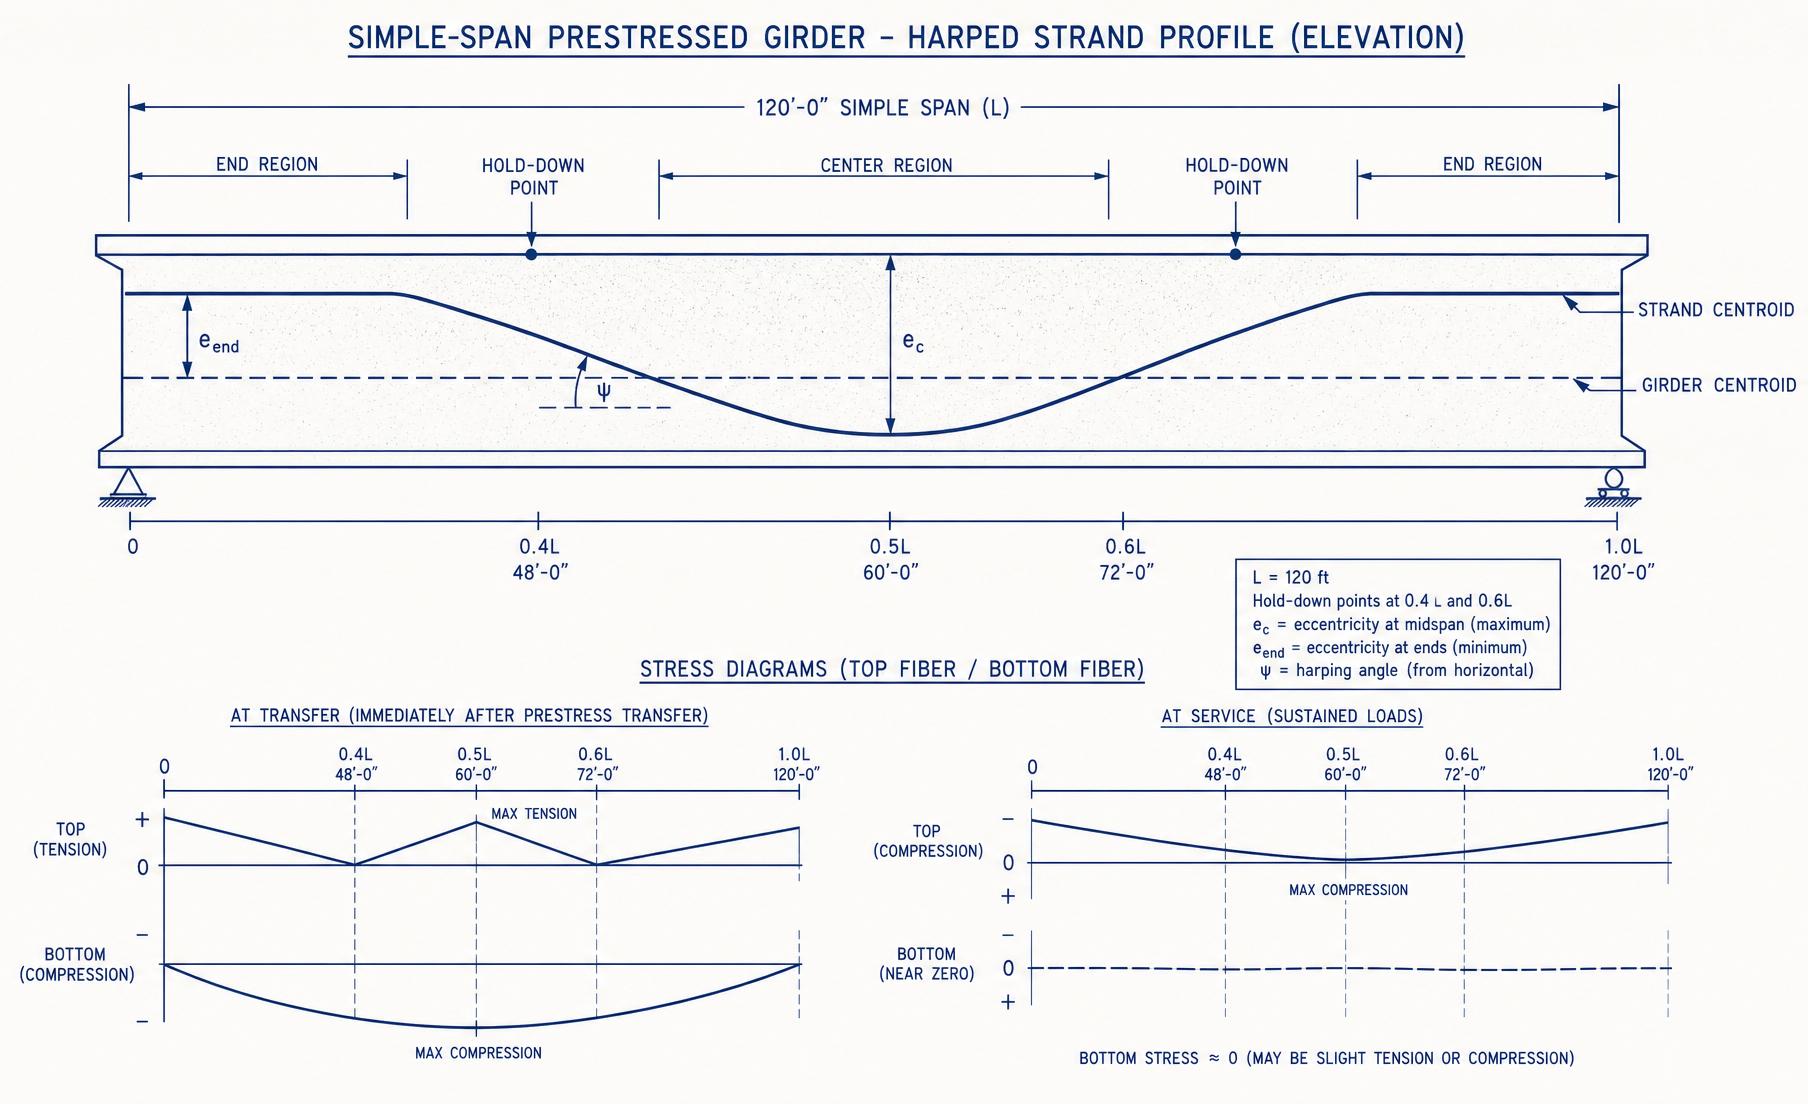
| Tendon profile | Straight + harped (2 hold-downs) | Fully draped (parabolic) |
| Continuity over piers | Simple-span, made-continuous via deck | Fully continuous PT tendon |
7.2 — Materials
Strand, concrete, and stress limits
The workhorse strand is Grade 270 low-relaxation 7-wire strand, fpu = 270 ksi, fpy = 243 ksi, area Aps = 0.153 in² per 1/2 in strand or 0.217 in² per 0.6 in strand. The concrete used for pretensioned girders is high early-strength — release strengths f'ci of 5.5 to 7 ksi at 18 hours enable a one-day casting cycle, with 28-day strengths f'c of 8 to 10 ksi.
Jacking stress limits AASHTO LRFD §5.9.2.2
Limit
Result
- jacking stress in strand
- ultimate tensile strength (270 ksi)
Concrete stress limits at transfer (girder only) AASHTO LRFD §5.9.2.3.1
Compression
Tension (bonded reinf. present)
- compressive stress at transfer [ksi]
- tensile stress at transfer [ksi]
- release concrete strength [ksi]
Concrete stress limits at service (composite) AASHTO LRFD §5.9.2.3.2
Compression (top, sustained)
Tension (bottom, Service III)
- top-fiber compression, all sustained loads [ksi]
- bottom-fiber tension, Service III [ksi]
AASHTO §5.9.2.3 — the four checks that dominate design
7.3 — Prestress losses
Where the 20% goes
The strand does not deliver its full jacking force to the concrete. Between the jack and the finished bridge, roughly 18–25% of the stress is lost to five mechanisms. AASHTO §5.9.3 groups them as immediate (elastic shortening, anchorage seating for PT, friction for PT) and time-dependent (shrinkage of the concrete, creep of the concrete under sustained prestress, and relaxation of the steel).
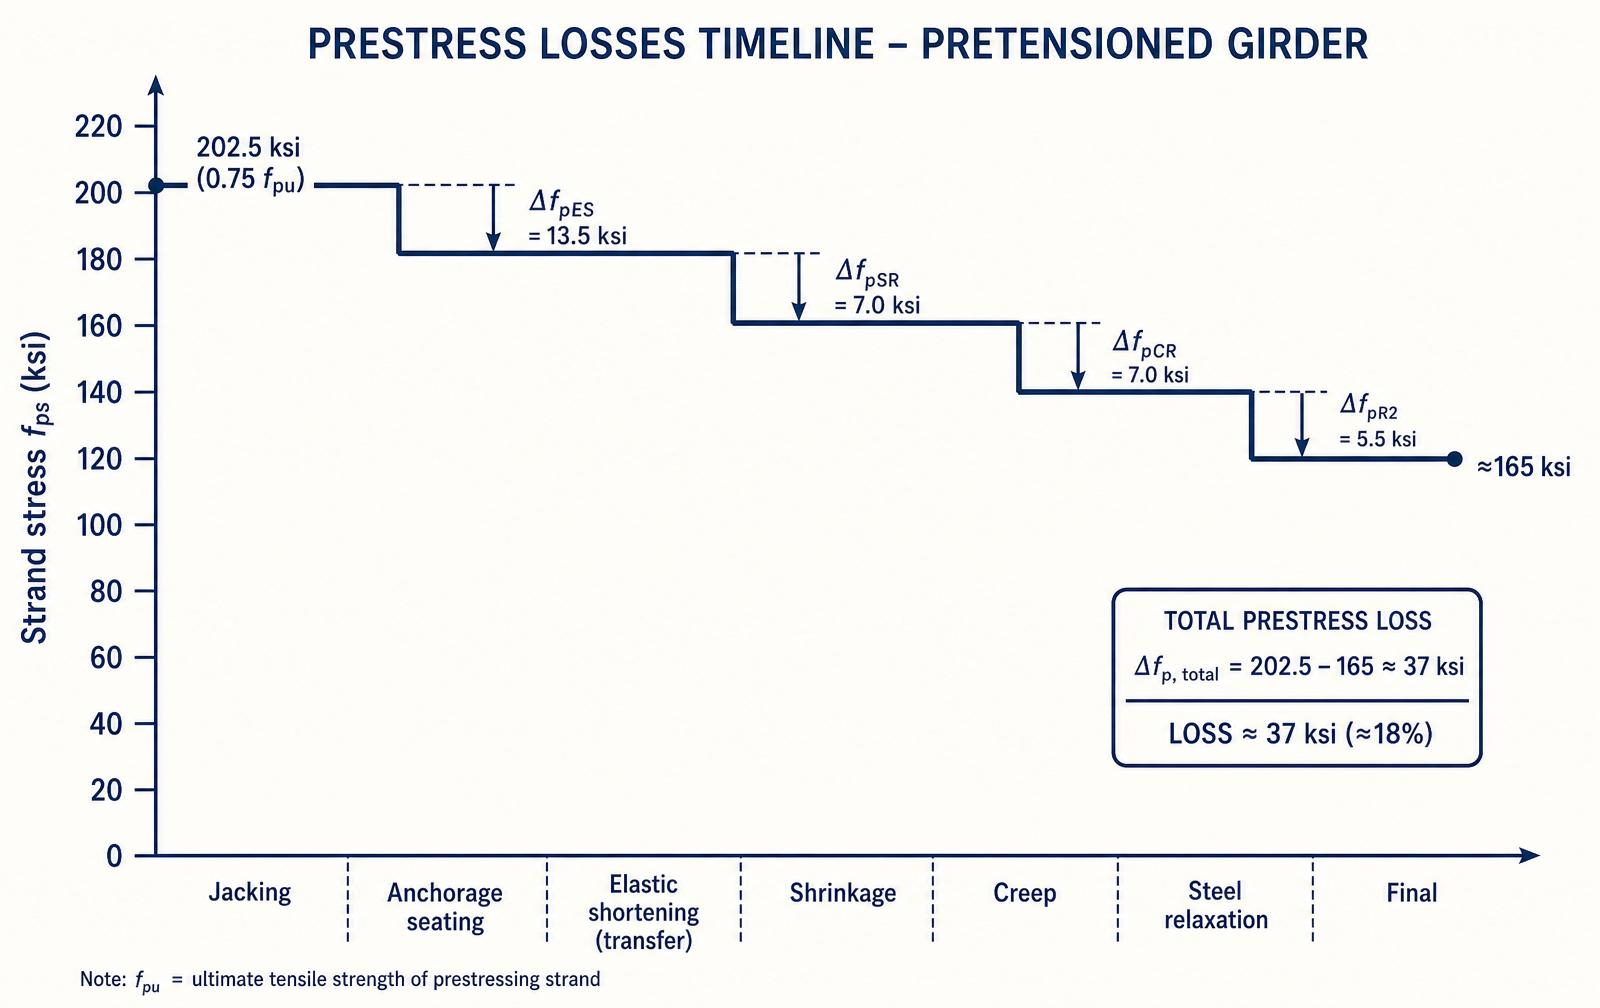
Elastic shortening loss AASHTO LRFD §5.9.3.2.3a
Formula
- loss due to elastic shortening [ksi]
- strand modulus (28,500 ksi)
- concrete modulus at release
- concrete stress at strand centroid due to prestress + self-weight [ksi]
Approximate long-term losses (§5.9.3.3, no deck)
Formula
- long-term loss (shrinkage + creep + relaxation) [ksi]
- humidity factor = 1.7 − 0.01·H (H in %)
- strength factor = 5 / (1 + f'_ci)
Which loss equation to use
7.4 — Stress at each stage
Four snapshots of one girder
A prestressed composite girder passes through four discrete stress states, and each must be individually checked. The section properties change midway (from girder only to girder + composite deck), so section moduli must be recomputed for the composite state.
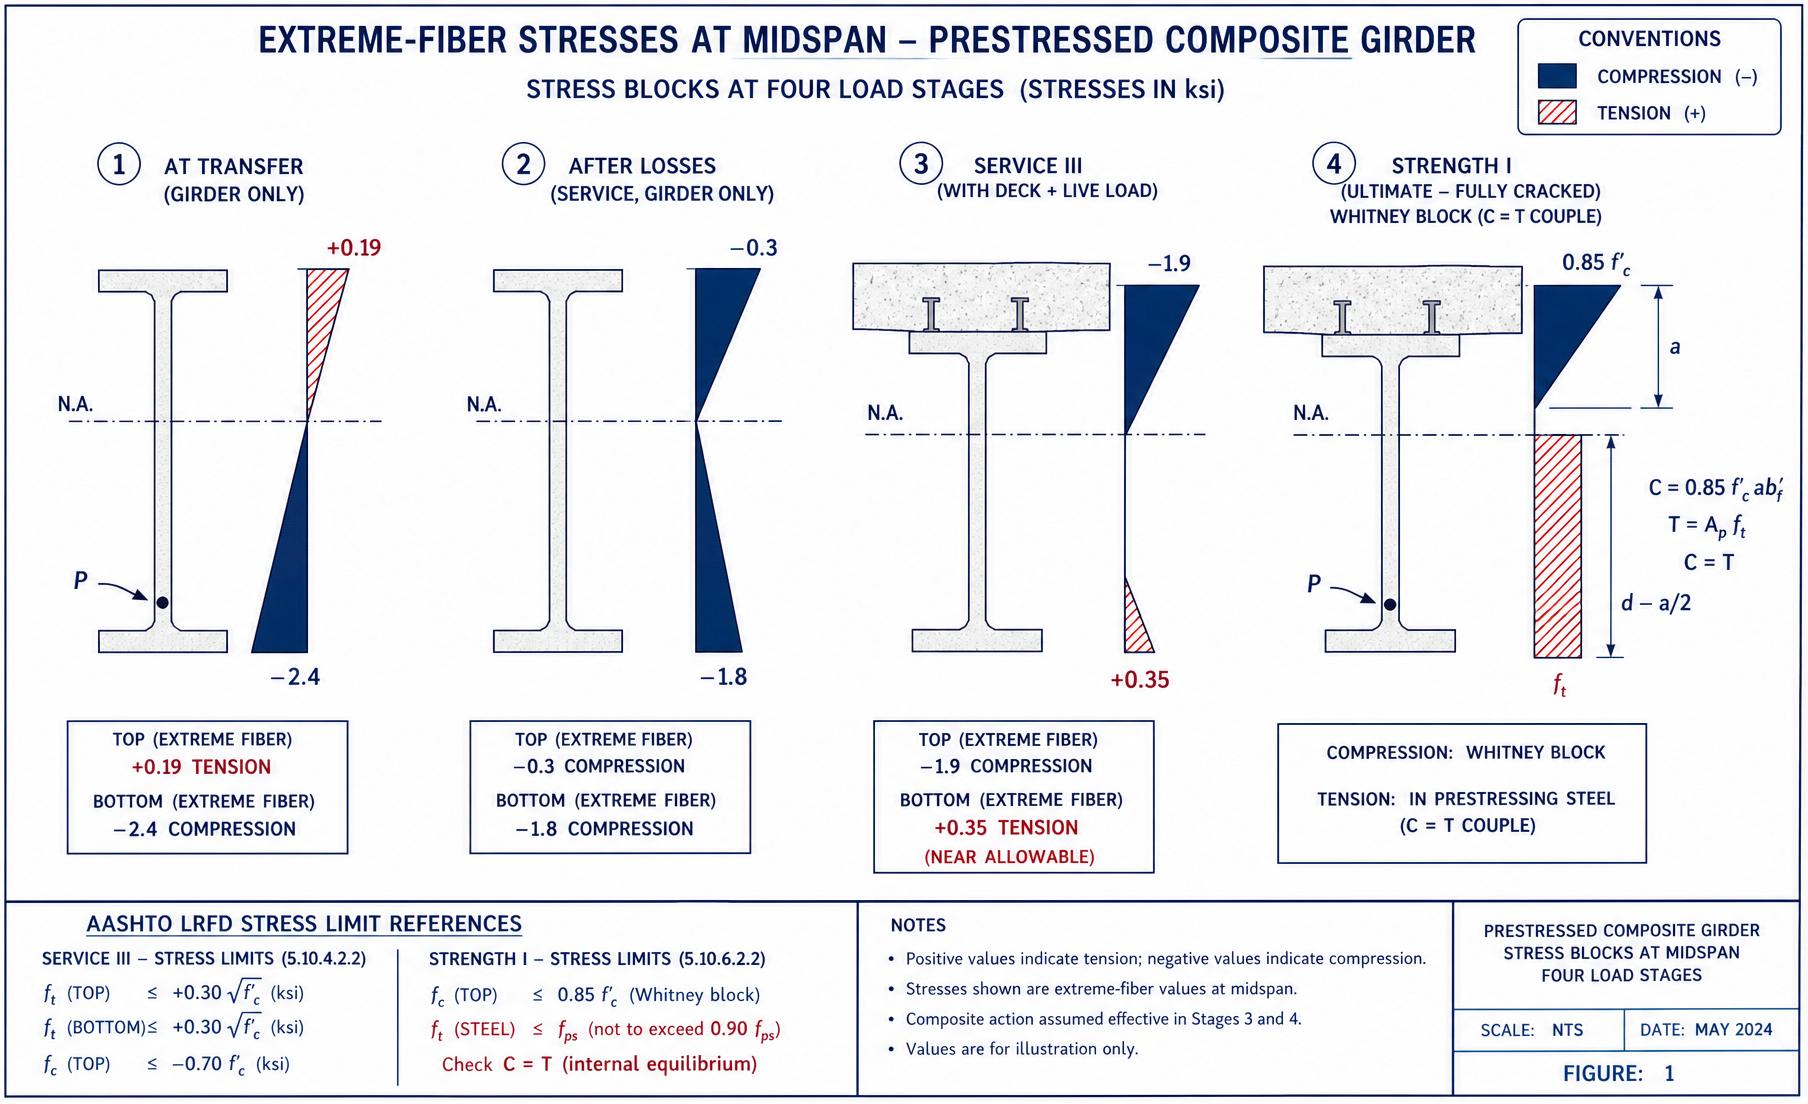
Extreme-fiber stress at any stage
Formula
- top / bottom extreme-fiber stress (- comp, + tens) [ksi]
- effective prestress force (after losses) [kip]
- strand eccentricity from girder neutral axis [in]
- girder section modulus, top / bottom [in³]
- composite section modulus [in³]
7.5 — Flexural resistance
Bonded tendon at ultimate
At ultimate the strand is far above yield but not at fpu. AASHTO §5.6.3.1.1 gives the stress in bonded prestressing steel at nominal flexural resistance, with the Whitney block on the compression side.
Steel stress at nominal moment
- prestressing steel stress at nominal moment [ksi]
- = 2·(1.04 − f_py / f_pu); 0.28 for Grade-270 low-relax
- distance from extreme compression fiber to neutral axis [in]
- depth from compression fiber to strand centroid [in]
Neutral-axis depth
- neutral-axis depth [in]
- total area of prestressing steel [in^{2}]
- effective flange width (composite deck) [in]
- Whitney factor, 0.85 for f'_c ≤ 4 ksi, − 0.05 per ksi above 4
Nominal flexural resistance
- nominal flexural resistance [kip-in]
- = β_1 · c, Whitney block depth [in]
7.6 — Shear (MCFT)
Diagonal-strut model with a helping hand from harped strand
AASHTO §5.7.3 uses the modified compression field theory. The nominal shear resistance is the sum of a concrete contribution, a stirrup contribution, and — for pretensioned girders with harped strand — the vertical component of the prestressing force at the section, Vp.
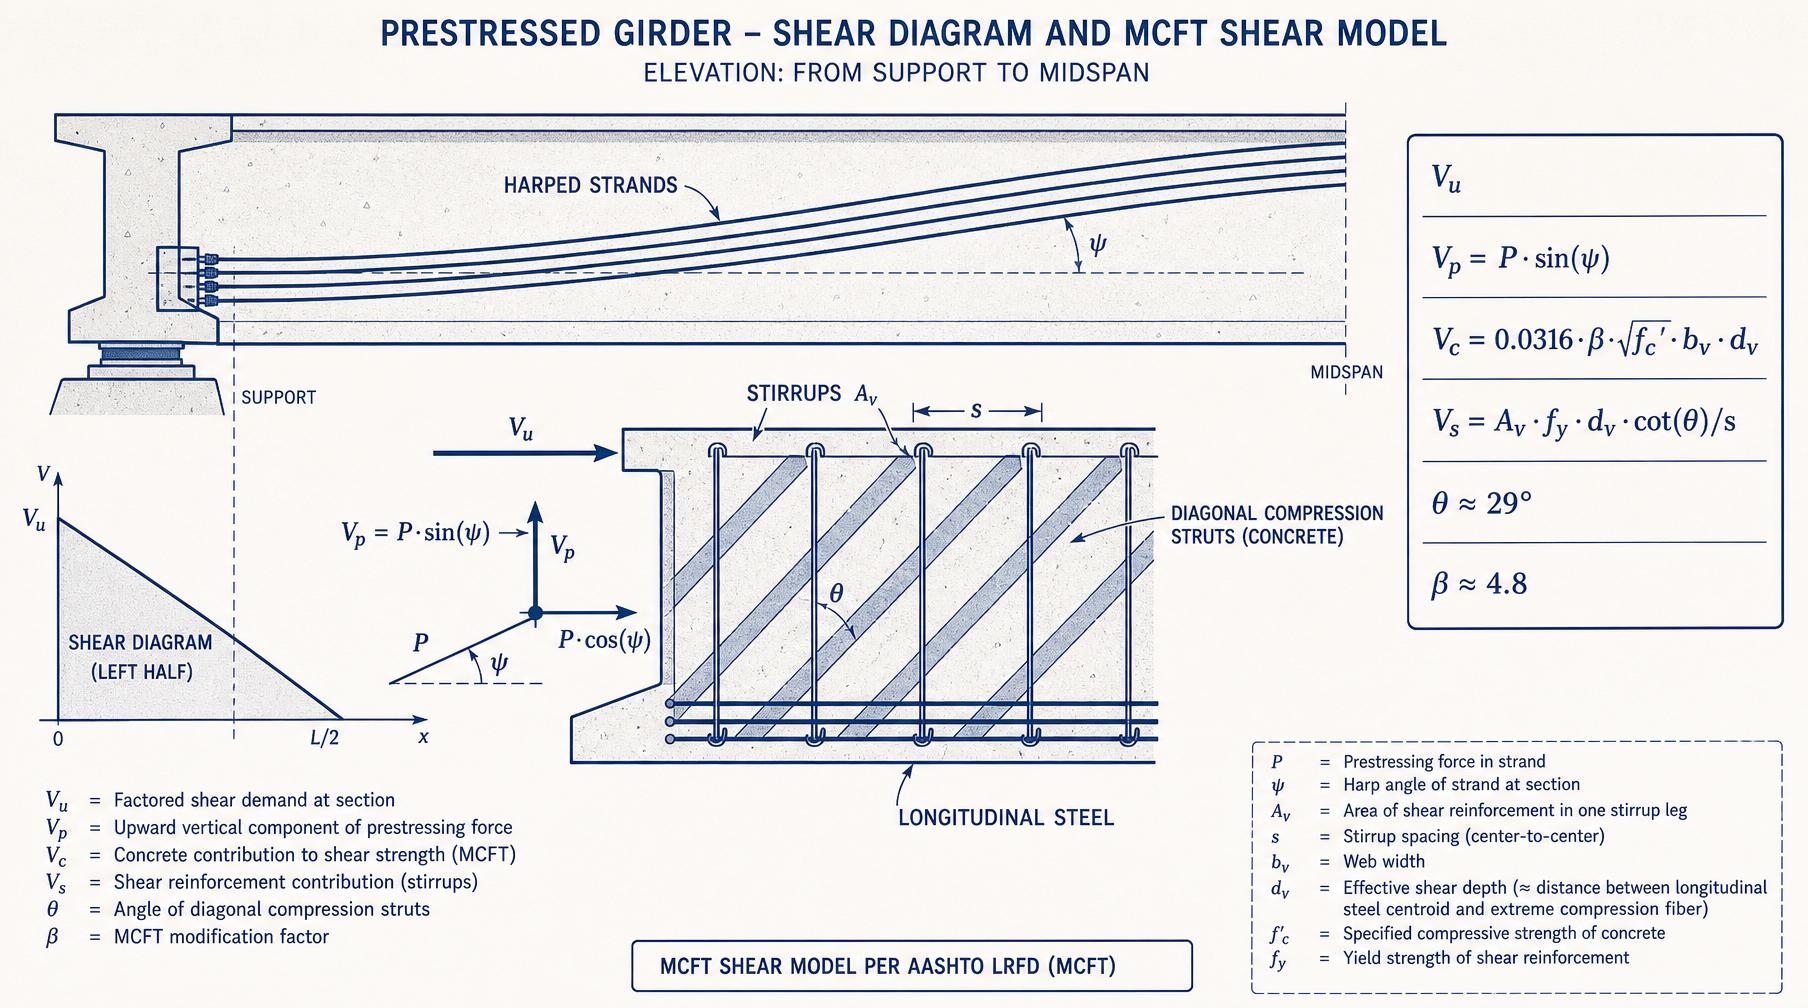
Formula
- nominal shear resistance [kip]
- concrete tension carrying factor (§5.7.3.4)
- diagonal-strut angle (§5.7.3.4)
- effective web width [in]
- effective shear depth [in]
7.7 — Worked example 1
AASHTO Type-VI pretensioned girder — Interior girder, 130 ft simple span
Problem statement
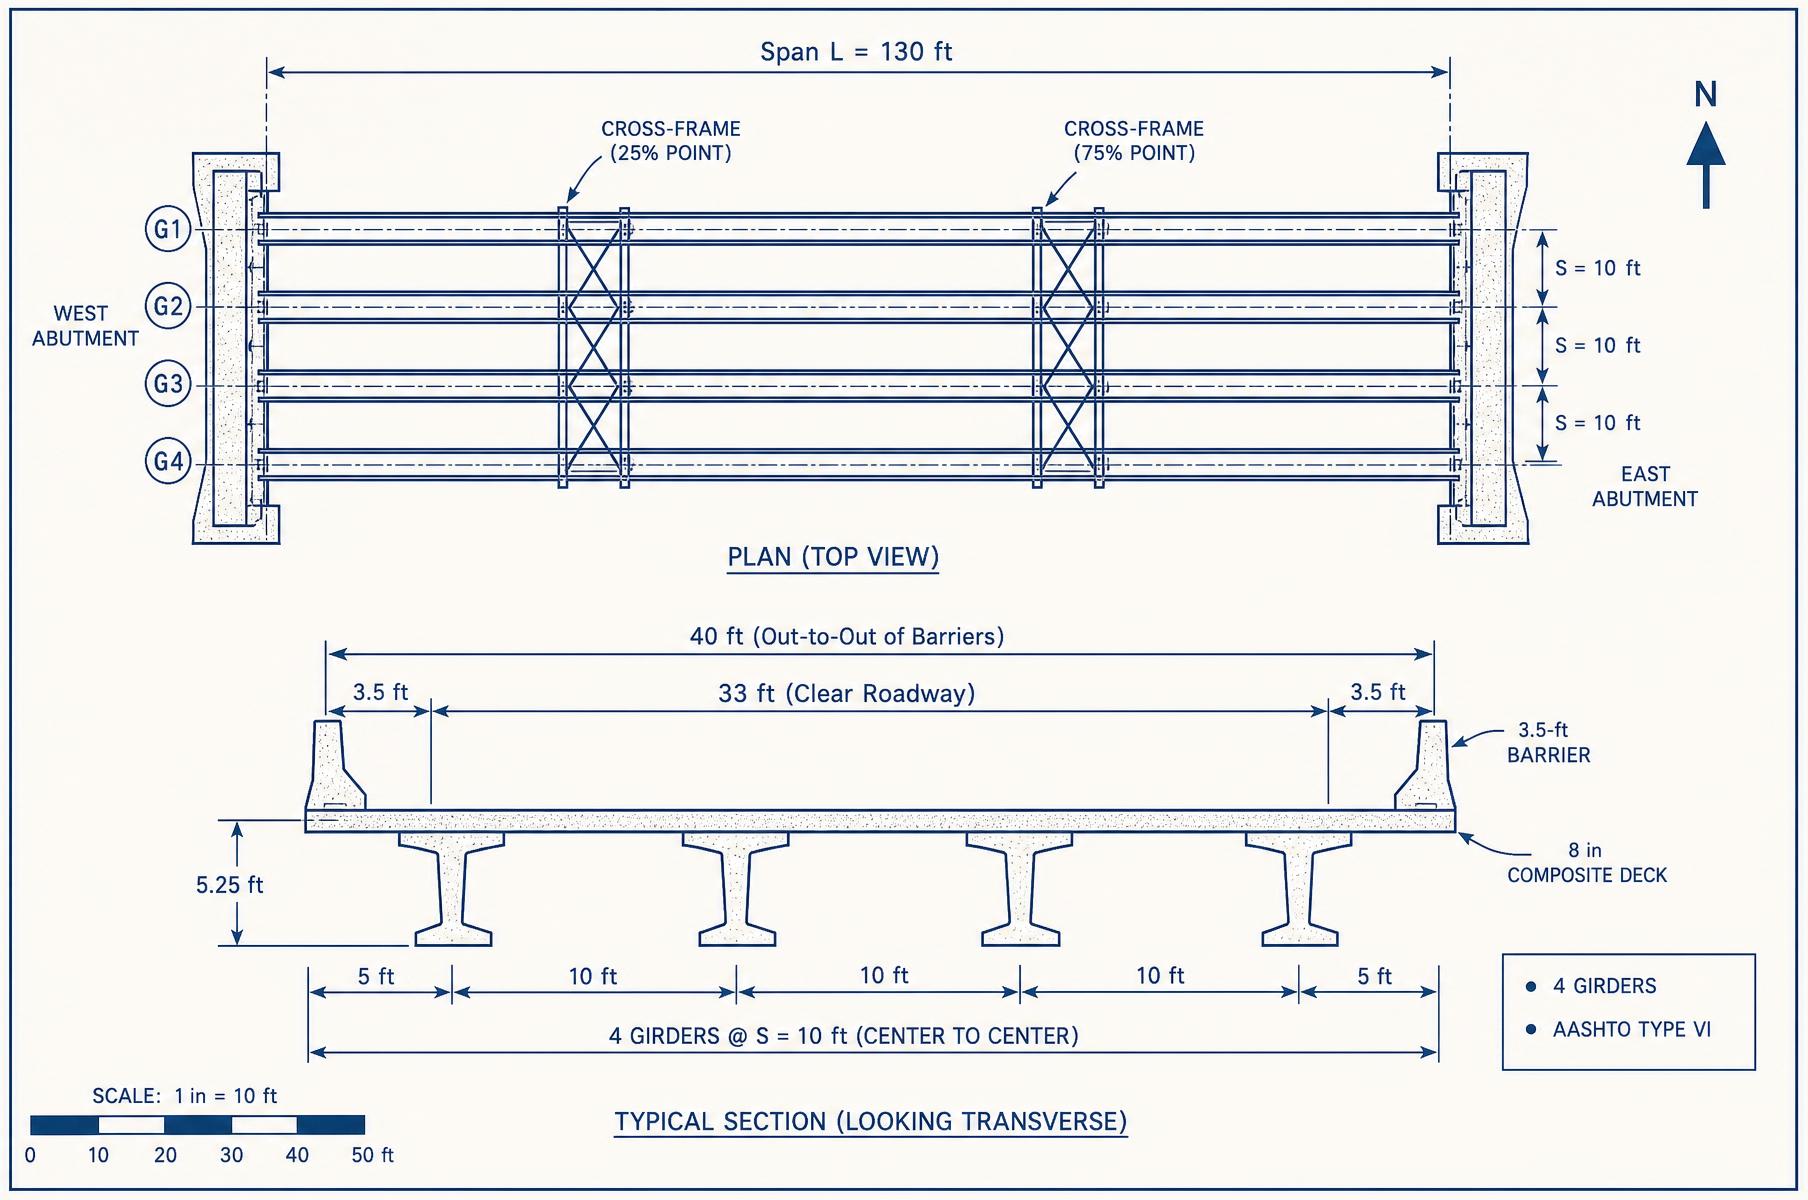
A single-span, 4-girder interior girder from a 130 ft roadway crossing. Design the interior girder for Strength I flexure, Service III bottom tension, transfer / lifting stresses, and Strength I shear.
Given
- SpanL = 130 ft simple span (4 girders)
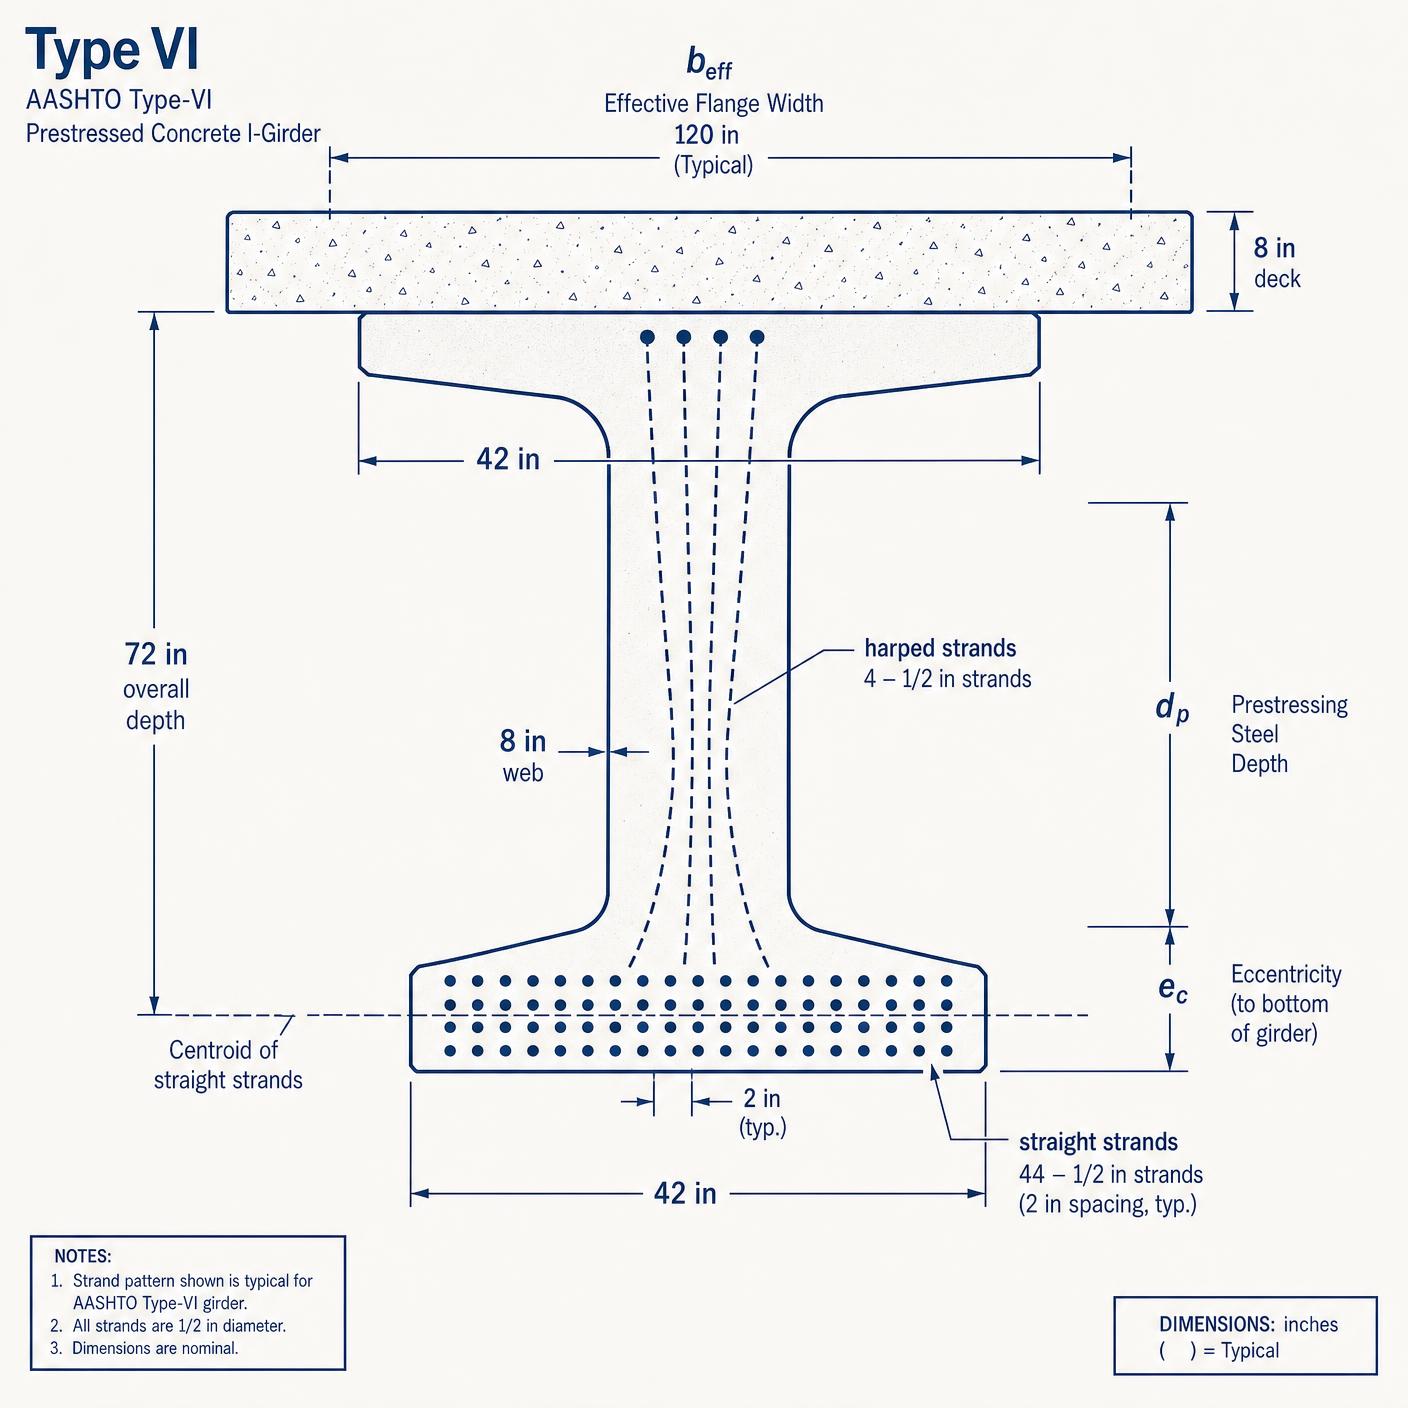
- GirderAASHTO Type VI, depth 72 in
- Ag1,085 in²
- Ig733,320 in⁴
- yb36.4 in
- Deck8 in composite CIP deck
- Girder spacingS = 10 ft o.c.
- f'c (girder)8.0 ksi
- f'c (deck)4.0 ksi
- f'ci (release)6.0 ksi
- Mg1,420 k-ft (girder self-weight)
- Mdeck1,140 k-ft
- Mws240 k-ft
- MLL+IM2,350 k-ft (interior DF applied)
Step 1 — Strand centroid and eccentricity
Formula — centroid of straight strand block
Substitute
Result
Formula — with 4 harped strands raised to 66 in at midspan
Substitute
Result
Step 2 — Effective prestress after all losses
Formula — initial force before losses
Substitute
Result
Formula — approximate long-term losses (§5.9.3.3)
Substitute
Result
Formula — elastic shortening (Δf_pES) taken as 13.5 ksi from Eq. 7.4
Substitute
Result
Step 3 — Stress check at transfer (top fiber, midspan)
Formula — top-fiber stress at transfer, girder only
Substitute
Result
Transfer top-fiber tension limit §5.9.2.3.1
Step 4 — Stress check at transfer (bottom fiber, midspan)
Formula — bottom-fiber stress at transfer
Substitute
Result
Transfer bottom-fiber compression limit §5.9.2.3.1
Step 5 — Stress check at Service III (bottom fiber, midspan)
Formula — Service III bottom fiber, composite
Substitute
Result
Service III bottom-fiber tension limit §5.9.2.3.2b
Step 6 — Nominal flexural resistance φMₙ
Formula — neutral-axis depth (Eq. 7.8), b = b_eff = 120 in, β_1 = 0.65 for f'_c,deck
Substitute
Result
Formula — f_ps (Eq. 7.7)
Substitute
Result
Formula — nominal moment (Eq. 7.9)
Substitute
Result
Formula — Strength I moment
Substitute
Result
Step 7 — Shear at h/2 from support (critical section)
Formula — harped-strand vertical component (Eq. §5.7.3.4.2)
Substitute
Result
Formula — Strength I shear at h/2 from an HL-93 line-load run
Substitute
Result
Formula — MCFT concrete + steel + prestress (Eq. 7.10) with β = 4.8, θ = 29°
Substitute
Result
Design summary — Example 1
Final section detailing (from computed A_s)
AASHTO Type VI interior girder — 72 in deep, S = 10 ft, L = 130 ft
| Location | A_s required | Bars provided | Spacing / detail |
|---|---|---|---|
| Bottom flange — straight strands | Aps,req ≈ 6.45 in² | 44 × ½-in Grade-270 LR (A_ps = 6.73 in²) | 2-in grid, first row 2 in from soffit |
| Bottom flange — harped strands | Uplift for transfer / lifting stresses | 4 × ½-in Grade-270 LR (A_ps = 0.61 in²) | Hold-downs at 0.4L / 0.6L; e_end ≈ 15 in |
| Web shear — end 10 ft each end | Av/s ≥ 0.10 in²/in | #5 double-leg closed stirrups (A_v = 0.62 in²) | s = 6 in c/c |
| Web shear — interior 110 ft | Av/s ≥ 0.05 in²/in | #5 double-leg closed stirrups | s = 12 in c/c (≤ 0.4·d_v = 24 in ✓) |
| Top flange — temperature / shrinkage | 0.11 in²/ft each face (§5.10.6) | #4 @ 12 in each face, longitudinal | 1½-in clear cover |
7.8 — Worked example 2
Spliced post-tensioned bulb-tee — end-zone anchorage design
Problem statement
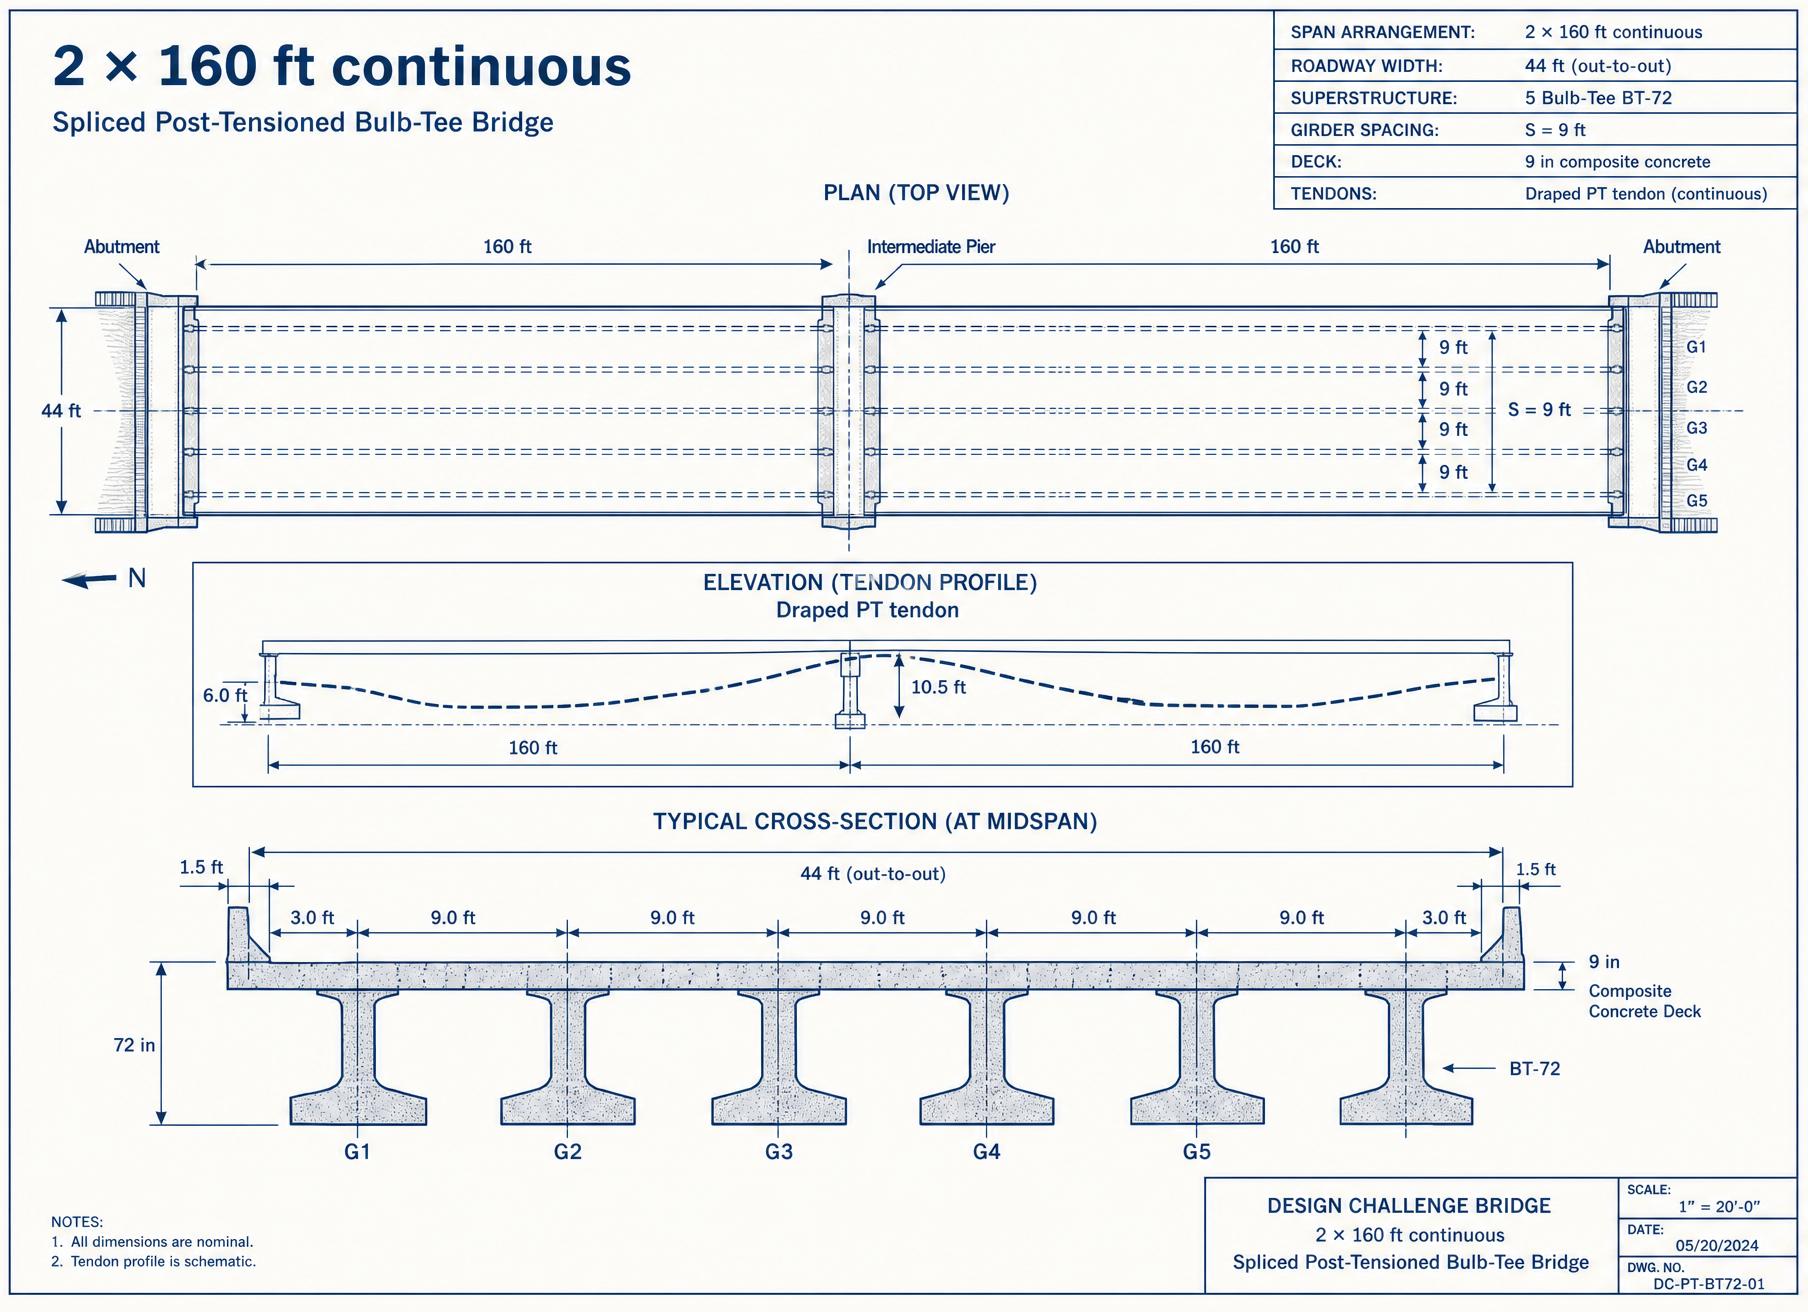
For a 2 × 160 ft continuous spliced BT-72 bridge (see Design Challenge, Figure 7.8), the end anchorage of the continuous PT tendon lands on a solid end block. Design the general-zone bursting reinforcement.
Given
- Bridge2 × 160 ft continuous spliced BT-72
- Tendon19 – 0.6 in Ø strands per duct
- Duct4 in Ø corrugated PT duct
- Jacking stress0.80·fpu at anchor
- Lock-off stress0.70·fpu after seating
- End blockSolid, h = 72 in, bw = 8 in
- Anchors per end4 tendons in vertical group
- f'ci6.0 ksi at stressing
- fy60 ksi (Grade 60)
Step 1 — Jacking force per tendon
Formula — jacking force
Substitute
Result
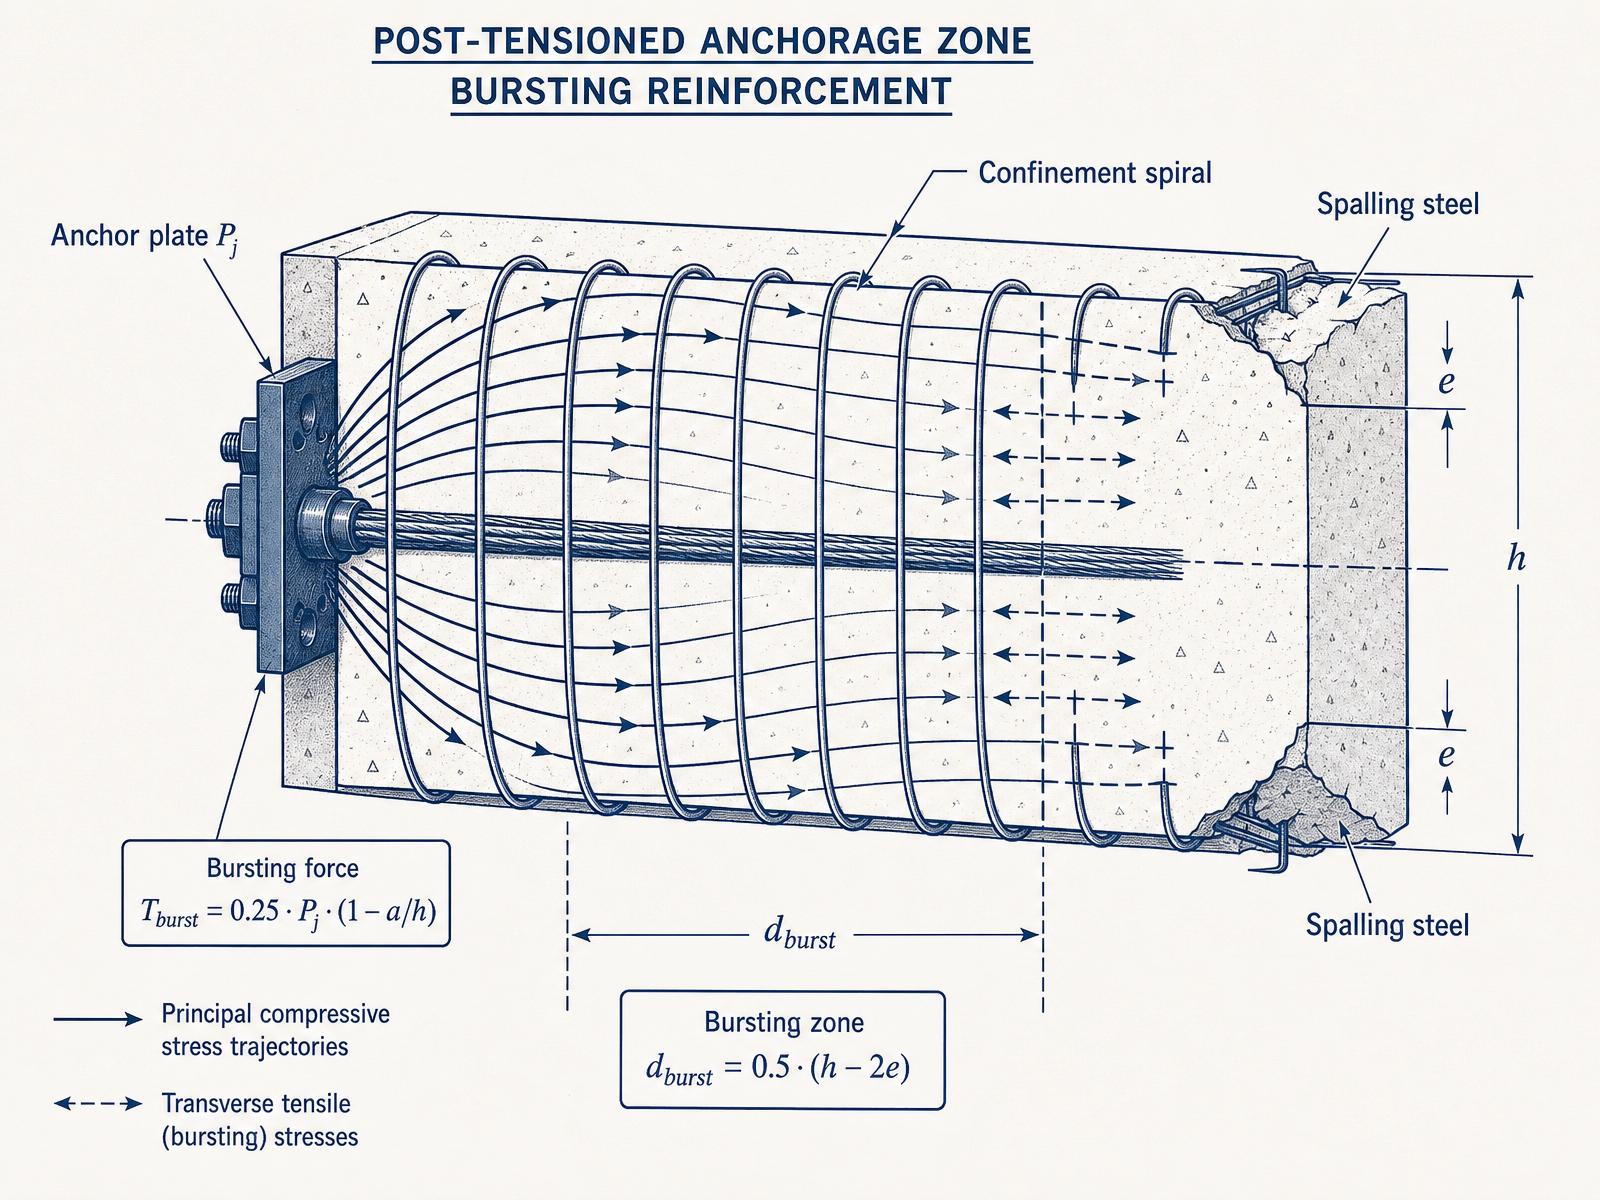
Step 2 — Bursting force (§5.9.5.6.3a)
Formula — bursting tension resultant
Substitute
Result
Step 3 — Bursting reinforcement area (§5.9.5.6.3b)
Formula — required steel area, φ = 0.85, f_y = 60 ksi (limit to 20 ksi effective stress)
Substitute
Result
Step 4 — Distribution over bursting depth
Formula — bursting depth (§5.9.5.6.3c)
Substitute
Result
Formula — hoop / stirrup count required within d_burst
Substitute
Result
Anchorage-zone design summary
Final end-block detailing (from computed A_s,burst)
BT-72 solid end block — h = 72 in, bw = 8 in, 4-tendon anchor group
| Location | A_s required | Bars provided | Spacing / detail |
|---|---|---|---|
| General-zone bursting steel (within d_burst = 30 in from loaded face) | As,burst ≥ 43.6 in² | #6 closed hoops, double-leg (A_bar = 0.88 in²) × 50 hoops | s = 3 in c/c over 30 in behind anchor |
| Local-zone confinement (each anchor) | Per anchor supplier's approved GZR | #4 spiral, 8-in Ø × 20 in long | 2.5 in pitch |
| Spalling steel — loaded face | Tspall ≈ 0.02·ΣPj = 71 kip → As ≥ 1.2 in² | 2 layers #5 orthogonal mat (A_s = 1.24 in²) | Within 0.5·h = 36 in of loaded face |
| Skin / longitudinal side face | 0.012·(h − 30) per §5.6.7 = 0.50 in²/ft each face | #5 @ 12 in each face, longitudinal | Full depth of end block |
7.9 — Spliced post-tensioned girders
How you get to 300 ft with precast components
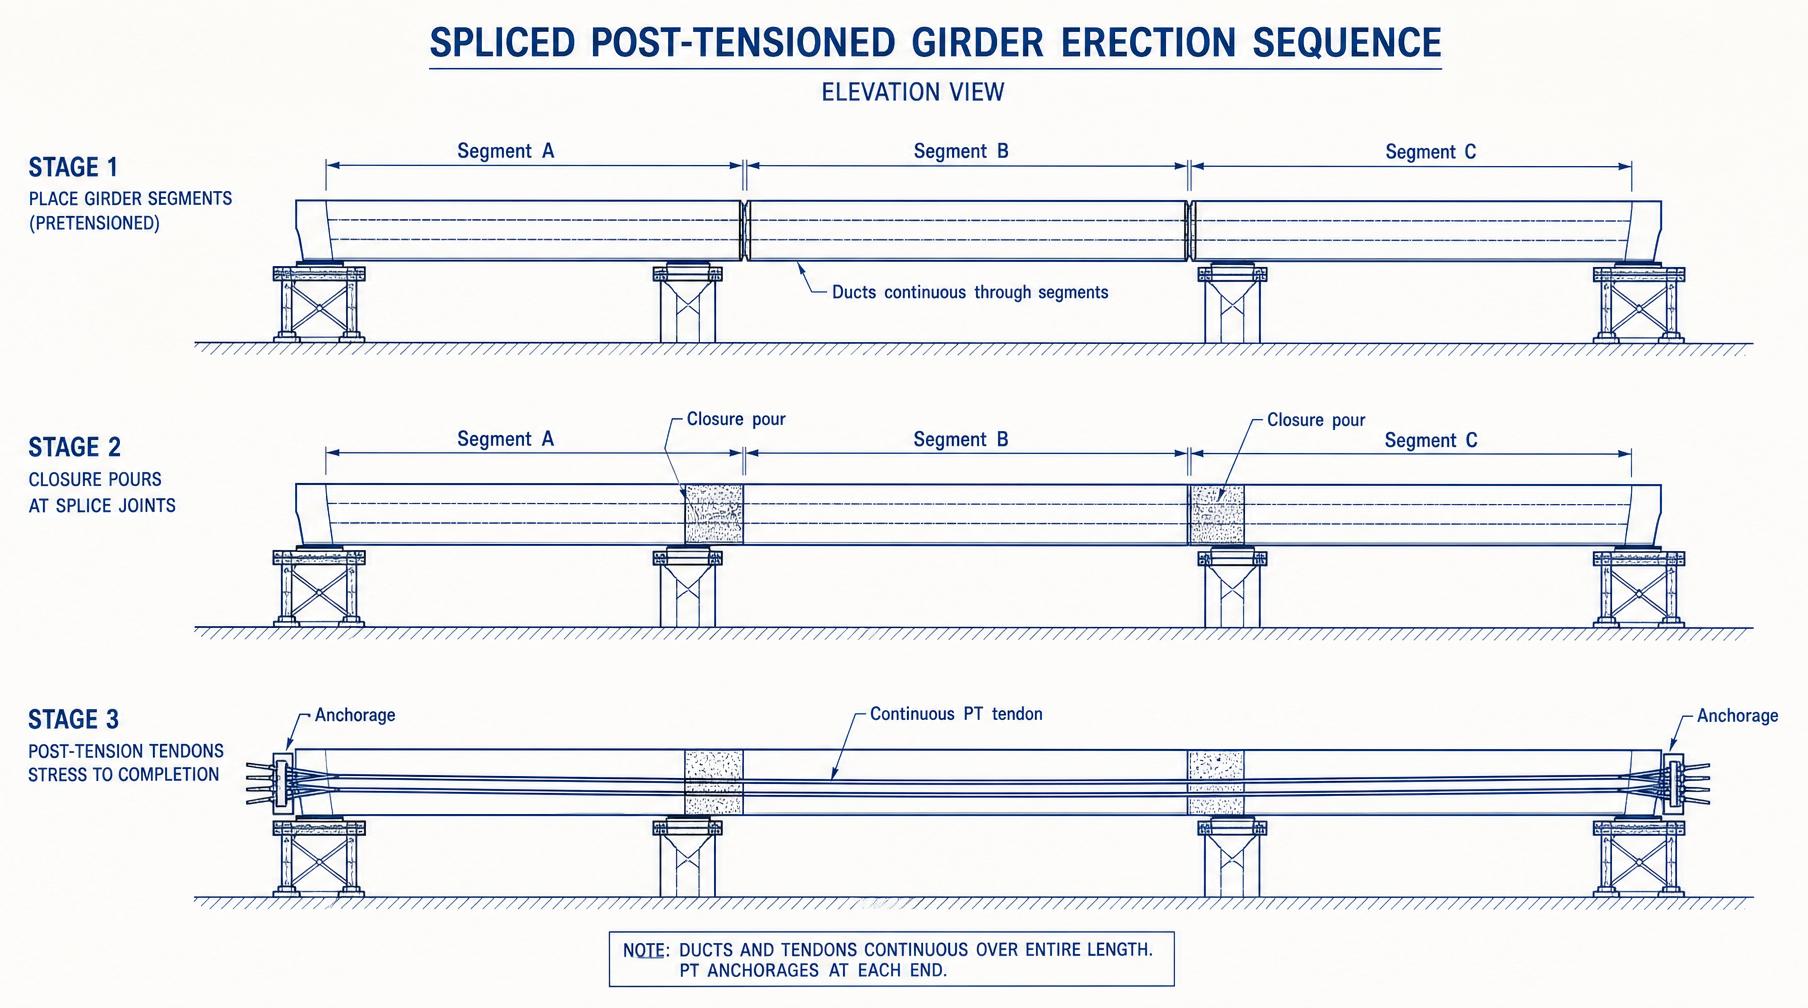
Spliced construction combines the plant quality of pretensioning with the span reach of post-tensioning. Design implications: (i) the section carries different amounts of prestress at different times, so a time-step loss analysis (§5.9.3.4) is required; (ii) closure pours introduce a locally different concrete age and modulus — check stress transfer across the joint; (iii) the continuous PT tendon changes the continuity moments over the pier, and secondary moments Msec (from prestress restraint) must be added to the DL + LL envelope.
7.10 — Camber and deflection
What the girder does between plant and paving
Camber (upward deflection under prestress) is calculated at release, before deck placement, and long term after all sustained loads. The PCI multiplier method scales the elastic release camber by empirical factors to represent the effect of creep over time.
Formula
- upward camber at release [in]
- initial prestress force (after ES loss) [kip]
| Stage | PCI multiplier (no composite topping) | PCI multiplier (with composite topping) |
|---|---|---|
| Prestress camber at release | 1.80 | 1.80 |
| Girder DL deflection at release | 1.85 | 1.85 |
| Prestress camber, long-term (final) | 2.45 | 2.20 |
| Deck / topping DL, long-term | — | 2.40 |
7.10b — Design Example 6
Prestressed interior concrete girder (simple span, L = 80 ft)
This worked example — reproduced from Simplified LRFD Bridge Design (Design Example 6) — walks the complete AASHTO LRFD workflow for a pretensioned interior I-girder on an 80 ft simple span in central New York. Every check is presented as Equation → Substitute → Result so the formula is stated first before any numbers are entered.
Problem statement
Design the interior prestressed concrete girder of a two-lane simple-span highway bridge (AASHTO HL-93) for Strength I flexure and Service I concrete stresses at release and after all losses.
Given
- Span L80 ft (simple span)
- Girder spacing S7.5 ft (5 girders)
- Overhang3.75 ft
- Slab thickness t_s8 in (7.5 in structural + 0.5 in integral wearing)
- Girder depth51 in (I-beam, 18-in top flange, 24-in bottom flange)
- Basic beam A_g762 in²
- Basic beam I_g212,450 in⁴
- S_nc,top / S_nc,bottom7,692 in³ / 9,087 in³
- y_b (basic beam)23.38 in
- Strand pattern A_ps44 × ½-in 7-wire Grade 270 = 6.732 in²
- Strand centroid g5 in from bottom → e_m = 18.38 in
- Girder f'_c / f'_ci6.5 ksi / 6.0 ksi
- Slab f'_cs4.5 ksi
- f_pu, E_p270 ksi, 28,500 ksi
- FWS3-in bituminous @ 0.140 kip/ft³
- Barrier / parapet0.506 kip/ft (each of 2 barriers)
- Ambient RH70 % (central NY)
Required
Determine the composite section properties, the factored midspan moment M_u (Strength I), the girder capacity φM_n (= M_r), and the concrete stresses at midspan at release and after all long-term losses.
Step 1
Composite section properties (§4.6.2.6, §5.4.2.4)
Because the girder concrete ( ksi) is stiffer than the deck slab ( ksi), the slab width is transformed by the modular ratio before adding it to the girder.
Minimum depth check (Table 2.5.2.6.3-1)
Minimum depth for precast prestressed I-beam, simple span
Substitute
Result
Effective flange width (interior girder) — equals beam spacing
Substitute
Result
Concrete modulus (girder), AASHTO Eq. 5.4.2.4-1
Substitute
Result
Concrete modulus (slab)
Substitute
Result
Modular ratio (girder / slab)
Substitute
Result
Transformed slab area (structural thickness = 7.5 in)
Substitute
Result
Composite area
Substitute
Result
Locate the composite centroid by taking moments about the basic girder centroid ( to the top of the girder), then find the composite section moduli.
Shift of centroid from basic beam c.g.
Substitute
Result
Composite y'_b (bottom fiber to composite c.g.)
Substitute
Result
Composite y'_t (slab top to composite c.g.)
Substitute
Result
Composite moment of inertia (parallel-axis on both parts)
Substitute
Result
Composite section modulus — bottom fiber
Substitute
Result
Composite section modulus — slab top
Substitute
Result
Step 2
Live-load, dead-load and factored midspan moments
Dynamic load allowance applies to the truck / tandem axles (not to the lane load). Interior-beam distribution factors use the stiffness parameter term for cross-section type (k).
DFM — one lane loaded (interior) — §4.6.2.2.2b
Substitute
Result
DFM — two or more lanes loaded (interior) — governs
Substitute
Result
Truck moment — take moments about support B with the middle 32-kip axle placed at midspan.
Reaction at A (ΣM_B = 0)
Substitute
Result
Truck midspan moment
Substitute
Result
Tandem midspan moment
Substitute
Result
Lane midspan moment (w = 0.64 kip/ft)
Substitute
Result
Distributed LL + IM per girder — truck governs
Substitute
Result
Dead loads — beam self-weight and slab dead load act on the basic (non-composite) section; barrier and future wearing surface act on the composite section and are distributed equally over the 5 girders.
Beam self-weight (A_g × w_c)
Substitute
Result
Slab dead load (t_s × S × w_c, full 8-in slab)
Substitute
Result
Total non-composite DC
Substitute
Result
Future wearing surface DW (3 in bituminous)
Substitute
Result
Strength I factored midspan moment (η = 1.0)
Substitute
Result
Step 3
Girder moment capacity φM_n (= M_r)
Assume rectangular behavior — the neutral axis is expected to sit inside the 7.5-in slab (verify after). The distance from the extreme compression fiber (top of slab) to the strand centroid is:
Effective depth to prestressing steel
Substitute
Result
Whitney stress block factor β₁ (§5.7.2.2)
Substitute
Result
Neutral axis depth c — Eq. 5.7.3.1.1-4 (rectangular, no A_s, A'_s)
Substitute
Result
Average prestressing steel stress — Eq. 5.7.3.1.1-1
Substitute
Result
Depth of equivalent rectangular stress block
Substitute
Result
Nominal flexural resistance — Eq. 5.7.3.2.2 (neglect mild steel)
Substitute
Result
Strength I flexural check
Factored resistance (φ = 1.0 for prestressed tension-controlled, §5.5.4.2)
Substitute
Result
Step 4
Concrete stresses at midspan at release of prestress
At release only the beam self-weight acts against the initial prestress force. Allowable stresses at time of transfer use ksi.
Allowable compression at transfer (§5.9.4.1.1)
Substitute
Result
Allowable tension at transfer (§5.9.4.1.2)
Substitute
Result
Concrete modulus at transfer, E_ci (Eq. 5.4.2.4-1)
Substitute
Result
Jacking and pre-transfer stresses (Table 5.9.3-1)
Substitute
Result
Elastic-shortening loss Δf_pES — Eq. C5.9.5.2.3a-1 (avoids iteration)
Substitute
Result
Prestress force after transfer
Substitute
Result
Superpose the three stress components — axial , bending from eccentricity , and bending from self-weight . Compression is negative.
Top-fiber stress at midspan (release)
Substitute
Result
Bottom-fiber stress at midspan (release)
Substitute
Result
Step 5
Final concrete stresses at midspan after all losses (except friction)
Long-term losses use the approximate expression of Eq. 5.9.5.3-1 for low-relaxation strand: humidity factor and strength factor .
Humidity factor (H = 70 %)
Substitute
Result
Strength factor at transfer
Substitute
Result
Long-term loss Δf_pLT — Eq. 5.9.5.3-1 (Δf_pR = 2.4 ksi for low-relaxation)
Substitute
Result
Total prestress loss and effective stress
Substitute
Result
Now split the fibre stresses in two stages: (a) prestress + non-composite DC on the basic beam, and (b) superimposed dead load + LL on the composite section (its stiffer denominator is the composite section modulus).
Stage (a) — bottom of basic beam (P_e + M_g + M_D)
Substitute
Result
Stage (a) — top of basic beam
Substitute
Result
Superimposed DC + DW per girder (2 barriers over 5 girders + 3-in FWS)
Substitute
Result
Stage (b) — bottom of composite (M_s + M_LL+IM on S_bc)
Substitute
Result
Stage (b) — top of slab
Substitute
Result
Service I limit-state stress checks (after all losses)
Girder-top compression allowable
Substitute
Result
Girder-bottom tension allowable (§Tbl. 5.9.4.2.2-1)
Substitute
Result
Design Example 6 — Summary
Results at a glance
| Check | Demand | Capacity / Allowable | Result |
|---|---|---|---|
| Strength I flexure φM_n | M_u = 4,243 ft-kip | M_r = 7,725 ft-kip | OK (1.82×) |
| Transfer — top tension | +0.23 ksi | 0.563 ksi | OK |
| Transfer — bottom compression | −2.91 ksi | 3.60 ksi | OK |
| Service I — girder top comp. | −1.311 ksi | 2.93 ksi | OK |
| Service I — girder bottom | −0.561 ksi (comp.) | 0.484 ksi tension limit not reached | OK |
| Total prestress loss | Δf_pT = 41.2 ksi (20.3 % of f_pj) | — | f_se = 161.3 ksi |
7.11 — Concept checkpoint
Three quick self-checks
- Why does the top-fiber stress at transfer usually govern strand pattern selection at the girder ends rather than at midspan?
- A designer proposes to eliminate the harped strand and use debonded straight strand instead. What two design concerns does this shift onto other reinforcement?
- The Service III bottom-fiber tension check just barely passes with the trial strand pattern. Name three levers you can pull before adding a strand.
7.12 — Design-check summary
Every AASHTO check for a PS girder
| Check | AASHTO | Governs |
|---|---|---|
| Jacking stress | §5.9.2.2 | Strand selection |
| Transfer top tension | §5.9.2.3.1 | Debond / harp length |
| Transfer bottom compression | §5.9.2.3.1 | Release strength f'_ci |
| Service III bottom tension | §5.9.2.3.2b | Strand quantity |
| Service I top compression | §5.9.2.3.2a | Deck / girder f'_c |
| Flexural strength φMₙ | §5.6.3 | Strand + section |
| Minimum reinforcement | §5.6.3.3 | φMₙ ≥ 1.33·M_u or M_cr |
| Fatigue on strand | §5.5.3 | Stress range at Fatigue I |
| Shear (MCFT) | §5.7.3 | Stirrup spacing |
| Anchorage zone (PT) | §5.9.5.6 | End-block reinforcement |
| Deflection / camber | §2.5.2.6.2 | L/800 live-load limit |
7.13 — Mini design challenge
2 × 160 ft continuous spliced BT-72 bridge
A rural arterial requires a two-span continuous prestressed girder bridge. Roadway width 44 ft out-to-out, 5 bulb-tees BT-72 at 9 ft spacing, 9 in composite deck,f'c = 8.0 ksi girder / 4.0 ksi deck. Design each interior BT-72 as a spliced post-tensioned girder with a continuous draped tendon (low at midspan, high over pier).
Deliverables
- Full HL-93 moment and shear envelopes (Strength I, Service I, Service III, Fatigue I).
- Strand pattern (straight + harped or full PT tendon layout) with computed ec(x).
- All §5.9.2.3 stress checks at transfer, deck placement, and Service III at midspan and over pier.
- φMₙ check at midspan (positive) and over pier (negative — deck reinforcement contributes to tension side).
- MCFT shear check at h/2 from support, at hold-down, and at pier face.
- Anchorage-zone bursting design at each end (§5.9.5.6).
- Camber schedule at release, 60 days, and long term; check L/800 live-load deflection.
Submit your design challenge
Upload your prestressed BT-72 design package
You must be signed in to upload a submission.
Sign in →Section 2
Fully Worked Examples
Complete AASHTO LRFD solutions with knowns, assumptions, step calculations, verification, and design commentary. Difficulty rises from basic to consulting-grade.
Worked Example 1
Problem
Step-by-Step
P_j = A_ps·f_pj = 4.34·202.5 = 879 kip
f_b = −P/A − P·e/S_b = −879/560 − 879·12/10,540 = −1.57 − 1.00 = −2.57 ksi (compression)
−2.57 ksi (comp)
Design Verification
Negative = compression by AASHTO convention. This 2.57 ksi is the "credit" the beam has before dead + live load try to tension the bottom fiber.
Discussion
The whole prestressing game: buy compression cheap at midspan bottom, spend it on tension caused by service loads.
Worked Example 2
Problem
Step-by-Step
ΔA = (n−1)·A_ps = 5.45·4.34 = 23.7 in²
ȳ_tr = (A_g·y_g + ΔA·y_ps)/(A_g + ΔA) shift ≈ 0.8 in down.
Design Verification
Only ~3% change — for hand design, gross section is close enough. Refined LRFD uses transformed at all stages.
Discussion
Once bonded, strands act with the beam. §5.9.1.1 lets you use either gross or transformed provided you're consistent.
Worked Example 3
Problem
Step-by-Step
ΔfpLT = 10·(f_pi·A_ps/A_g)·γ_h·γ_st + 12·γ_h·γ_st + ΔfpR
= 10·1.57·1.00·0.77 + 12·1.00·0.77 + 2.4 = 12.1 + 9.24 + 2.4 = 23.7 ksi
ΔfpLT ≈ 23.7 ksi
Design Verification
Long-term stress f_pe = 0.75·270 − 23.7 − ES ≈ 202.5 − 23.7 − 18 = 160.8 ksi ≈ 0.60 f_pu — typical bridge girder.
Discussion
Approximate method OK for standard beams with typical strand patterns. Refined per §5.9.3.4 for post-tensioned or unusual sections.
Worked Example 4
Problem
Step-by-Step
f_b = −P/A − P·e/S_b,nc + (M_DC1+DC2+DW)/S_bc-ish + 0.8·M_LL/S_bc = ...
P_e = 44·0.217·160 = 1,529 kip. f_b = −1.57·(44/20) − 1.62 + 3.30 = −0.31 ksi < 0.19√f′_c = 0.537 ksi allowable (Service III).
Design Verification
Bottom compression at transfer f_bi ≈ −3.6 ksi ≤ 0.65·f′_ci = −3.9 ✓; top tension +180 psi ≤ 3√f′_ci = 210 psi ✓ (§5.9.2.3.1a).
Discussion
Iterated on strand count to hit Service III (tension) with the smallest N. Strength never controls modern high-strength I-girders.
Worked Example 5
Problem
Step-by-Step
V_c = 0.0316·β·√f′_c·b_v·d_v = 0.0316·3.20·√8·6·68 = 116 kip
A_v = 2·0.20 = 0.40 in²; s = 12; V_s = A_v·f_y·d_v·cot θ / s = 0.40·60·68·1.96/12 = 267 kip
Design Verification
Vertical-strand component V_p carries ~30% of V_u — dropping it (straight strands) would need heavier stirrups (#5 @ 8 in).
Discussion
Harping vs debonding is a fabricator preference; both work but harping cleans up end-zone stress and reduces stirrup steel near supports.
Worked Example 6
Problem
Step-by-Step
A: 44·130 = 5,720 ft. B: 40·130 + 8·(130−30) = 5,200 + 800 = 6,000 ft.
A: harping reduces prestress at ends → OK. B: debonded strands controlled to 25% of total, ≤ 25% per row per §5.9.4.3.3 ✓
Design Verification
Both pass all limits. Modern precast plants prefer debonding — faster casting, less bed reconfiguration.
Discussion
Design optimization at the material level is small money; the real wins come from choosing the right girder shape (BT-72 vs Type VI vs FIB-96) for the span.
Worked Example 7
Problem
Step-by-Step
f_t = +P/A − P·e/S_t + M_sw/S_t = 1.51 − 1.65 + 0.62 = +0.48 ksi ≤ 0.24√5.5 = 0.563 ksi ✓
Additional creep + shrinkage losses ≈ 10 ksi. f_b ≈ −2.4 ksi (still compression) ✓
Design Verification
All hauling stresses clear with margin — bracing not required for L_lift < 140 ft on BT-72.
Discussion
Construction-stage governs the top-fiber tension check at release for every prestressed beam — never skip it.
Worked Example 8
Problem
Step-by-Step
ΔM = 3,800 − 3,150 = 650 k·ft
f_ps ≈ f_se + 10 ksi (external unbonded) = 170 ksi at ULS.
Design Verification
Check secondary moments (statically determinate girders → secondary = 0) and post-strengthening shear at supports.
Discussion
External PT retrofit is a standard consulting move to defer replacement 15–20 yr. Anchorage detailing and corrosion protection dominate cost.
Worked Example 9
Problem
Step-by-Step
V_ni = c·A_cv + μ·(A_vf·f_y + P_c) = 0.075·288 + 0.6·(3.52·60 + 0) = 21.6 + 126.7 = 148.3 kip
V_u,joint = D·sin(45°) = 155 kip > 148.3 kip. Interface shear NG.
FAILS interface shear
Design Verification
Reproduces NTSB finding: construction-stage interface shear at Node 11/12 was ~ 50% underdesigned.
Discussion
Every construction stage is a load case. Peer review must catch temporary conditions as rigorously as final ones.
Worked Example 10
Problem
Step-by-Step
g_int,strength = 0.075 + (S/9.5)^0.6 · (S/L)^0.2 · (K_g/12·L·t_s³)^0.1 → 0.63
M_LL+IM,strength = 3,400 k·ft/girder; M_DC1+DC2+DW = 2,880 k·ft; M_u = 9,600 k·ft.
Design Verification
Cross-checks: total strand steel 350 lb/beam; typical for 140-ft BT-72. Camber 6.5 in matches PCI camber curves ✓.
Discussion
This is the deliverable a structural EIT is expected to produce end-to-end. The real complexity is not the math — it's coordinating fabricator, hauler, and erector schedules.
Worked Example 11
Problem
Step-by-Step
d ≈ 8 − 2.5 − 0.5 = 5.0 in in the deck; add composite depth if using extended strands. Assume d = 72 in for full composite section.
A_s = M/(φ·f_y·0.9·d) = 2,200·12/(0.9·60·0.9·72) = 6.79 in²
Design Verification
Positive moment continuity reinforcement (§5.14.1.4.9) also required — extended bottom strands or #6 hooked bars into diaphragm.
Discussion
Simple-made-continuous is the most common PC bridge continuity detail in the US.
Worked Example 12
Problem
Step-by-Step
PV factor for 75 yr at 3% = (1−(1.03)^-75)/0.03 = 28.5. PC O&M PV = 4·28.5 = $114k. Steel = 9·28.5 = $257k.
PC: 1,350 + 114 = $1.464M. Steel: 1,500 + 257 = $1.757M.
PC wins by $293k (17%) on 75-yr NPV
Design Verification
PC I-girders dominate the 100–160 ft simply-supported market for exactly this LCCA reason. Steel wins on curved, long, or accelerated-erection projects.
Discussion
Never present cost without stating the discount rate and the assumed maintenance schedule — both sensitive.